
Strategy Styles Across Market Conditions
Three hypothetical demo strategies — momentum, trend-following and breakout — built on the same universe and tested over the same five years, then read year by year. None of them leads every row, and one exceptional year flatters all three.
What You’ll Learn
By the end of this article, you’ll understand:
- How momentum, trend-following and breakout styles differ in rules
- How each behaved through rising, choppy and falling stretches
- Why no style leads in every market
- How to read a comparison without picking a winner
Objective
Choosing the Right Investment Style argues that momentum, trend-following and breakout are patterns of settings rather than product modes, and that each has conditions it handles badly. This case study puts that argument against real history: three demo strategies, one per style, backtested over the same five years and read stretch by stretch.
The goal is not to find the best of the three. It is to see how each one behaved as conditions changed — when it held up, when it fell behind, and what it cost to sit through. Everything below is hypothetical: demo strategies and their backtests, used to show how to read a comparison, not strategies to copy and not a forecast of any return.
Approach
A comparison only says something about style if style is the only thing that differs. So every setting that is not a signal rule was held constant across all three:
- The same opportunity set — the Nifty 200, a Market Cap floor of 5,000 Crores+, a Liquidity floor of 1 Crore+, with penny and T2T stocks excluded.
- The same portfolio rules — 15 holdings, an Exit Rank of 30, no Exit Delay, Reinvest mode, and no Fixed or Trailing Stop Loss.
- The same test — ₹5,00,000 from 12 October 2021 to 12 October 2026, with a 0.1% transaction cost on every buy and every sell.
Because the period and costs match, Compare Results shows no Comparison Quality warning for these three — the page has nothing to flag about the comparison being uneven. What it cannot tell you is whether five years is enough history to judge a style. That question is the rest of this article.
Strategy design: three sets of signal rules
| Setting | Style · Momentum | Style · Trend Following | Style · Breakout |
|---|---|---|---|
| 52 Week High Filter | None | None | Within 5% |
| Moving Averages | None | 50-day and 200-day SMA | None |
| ROC windows | 3-Month + 6-Month | 12-Month | 1-Month + 3-Month |
| Ranking Method | Absolute Returns | Volatility Adjusted Returns | Absolute Returns |
| Super Trend Filter | None | Slow | Fast |
| Rebalance Frequency | Weekly (Monday) | Monthly (1st) | Weekly (Monday) |
Momentum ranks on recent strength and nothing else. Every week the Nifty 200 is ranked by its 3-month and 6-month price change, the two ranks are averaged, and the strategy holds the fifteen highest. There is no trend check and no Super Trend Filter, so a holding leaves only when it slips below 30th place at a rebalance.
Trend following waits for confirmation and reviews less often. The 50-day and 200-day moving averages act as a trend condition before any ranking happens; the survivors are ranked on 12-month change, weighed against the volatility that produced it; and the Slow Super Trend Filter asks for stronger confirmation still. All of this is checked once a month.
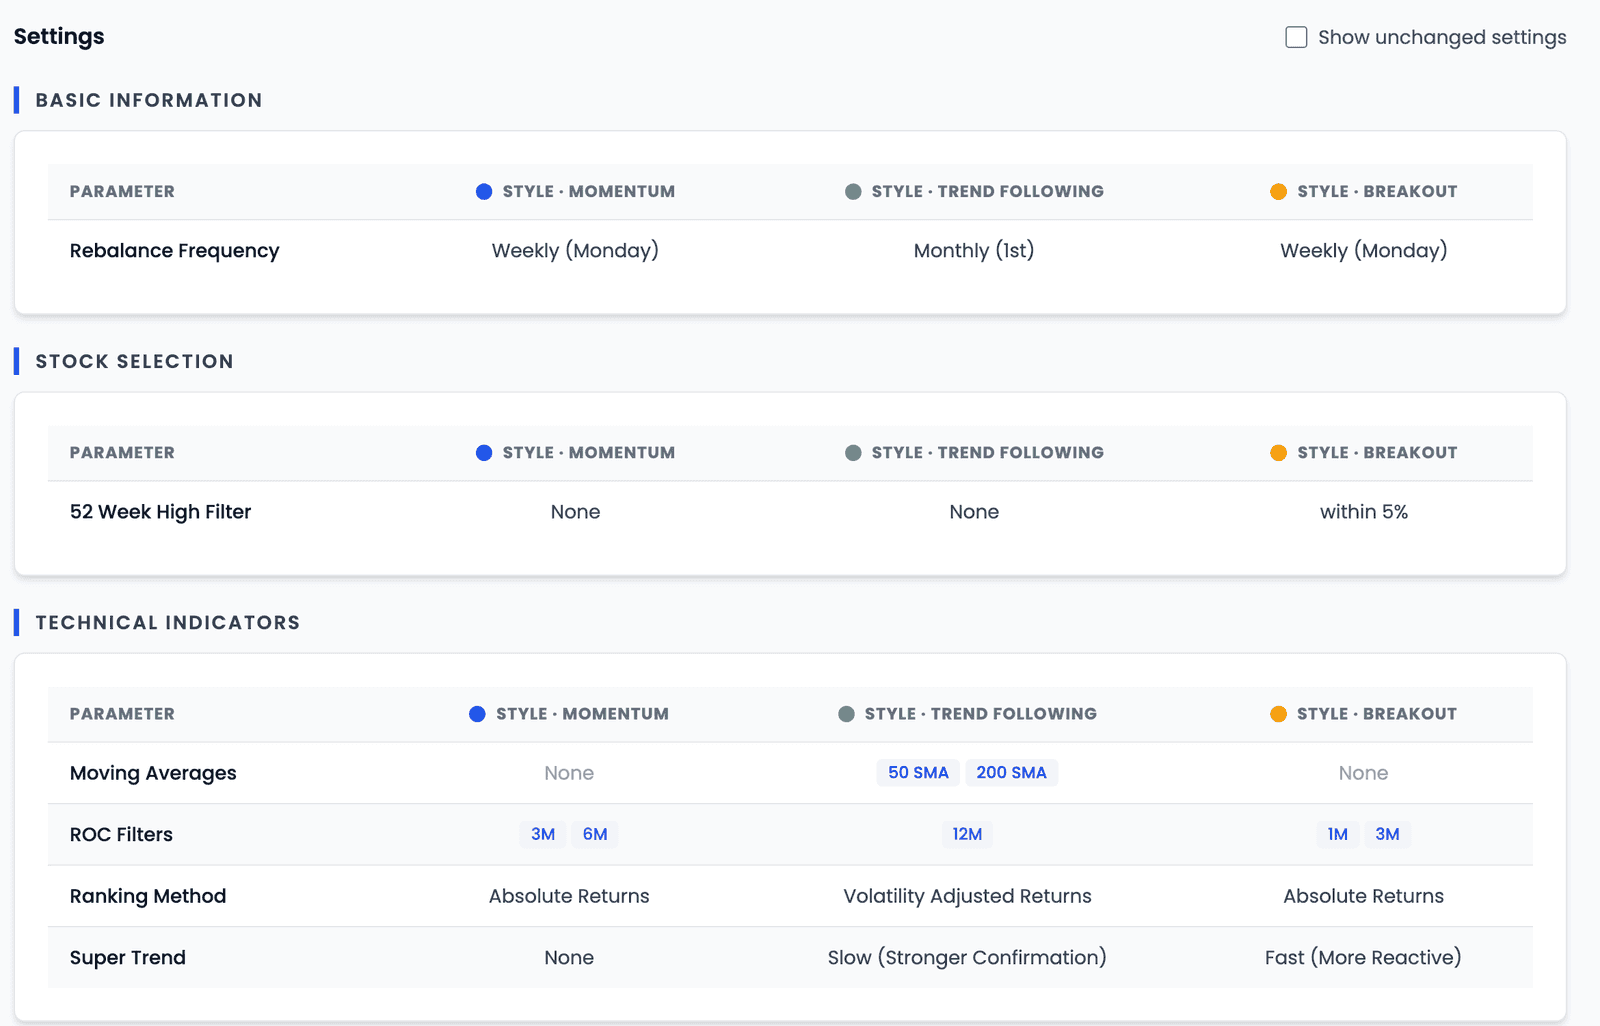
Breakout only considers stocks trading within 5% of their 52-week high — an eligibility rule, applied before ranking. It then ranks on the shortest windows of the three, 1-month and 3-month change. Its Fast Super Trend Filter is evaluated at each weekly rebalance, and a held stock that fails it is sold. That is not a daily stop: on a weekly schedule the check comes round often, which makes the strategy quick to let go.
All three follow the same end-of-day model. For the weekly pair, Friday's closing data generates the signals and trades execute at Monday's official close.
Review of outcome
Risk first
| Metric | Style · Momentum | Style · Trend Following | Style · Breakout |
|---|---|---|---|
| Max Drawdown | −25.04% | −20.45% | −29.53% |
| Longest Drawdown Days | 366 | 237 | 384 |
| Volatility | 24.94% | 18.70% | 24.12% |
| Total Trades | 319 | 101 | 254 |
| Avg / Max Holding (days) | 83 / 372 | 229 / 823 | 96 / 753 |
| CAGR | 32.39% | 20.48% | 35.52% |
| Sharpe Ratio | 1.27 | 1.11 | 1.40 |
| Score (product's band) | 82 · Excellent | 88 · Excellent | 84 · Excellent |
Read the top two rows before the CAGR. Breakout spent the longest stretch below a previous high — 384 days, more than a year without a new peak — and took the deepest fall on the way. Momentum was close behind on both. Trend following fell least and spent the shortest time underwater. Over the same window the Nifty 50 benchmark grew at 4.45% a year.
The product labels all three Excellent. That band is the product's summary of one backtest each, not this article's assessment — and it is worth noticing that the highest Score went to the strategy with the lowest CAGR.
Year by year
| Year | Momentum | Trend Following | Breakout |
|---|---|---|---|
| 2021 (from mid-October) | −1.39% | 0.00% | −4.89% |
| 2022 | 24.16% | 3.87% | 41.97% |
| 2023 | 94.55% | 56.85% | 102.85% |
| 2024 | 54.36% | 46.85% | 48.51% |
| 2025 | 3.84% | 2.66% | 6.63% |
| 2026 (to 12 October) | 6.49% | 3.36% | 5.36% |
One year inflates every CAGR here
2023 was an exceptional year for momentum and mid-cap-leaning stocks, and it inflates every CAGR in this article. Two of the three strategies roughly doubled in that single year. A five-year average that contains a year like that describes the year at least as much as the rules — none of these figures is a return that can be expected or repeated.
By stretch
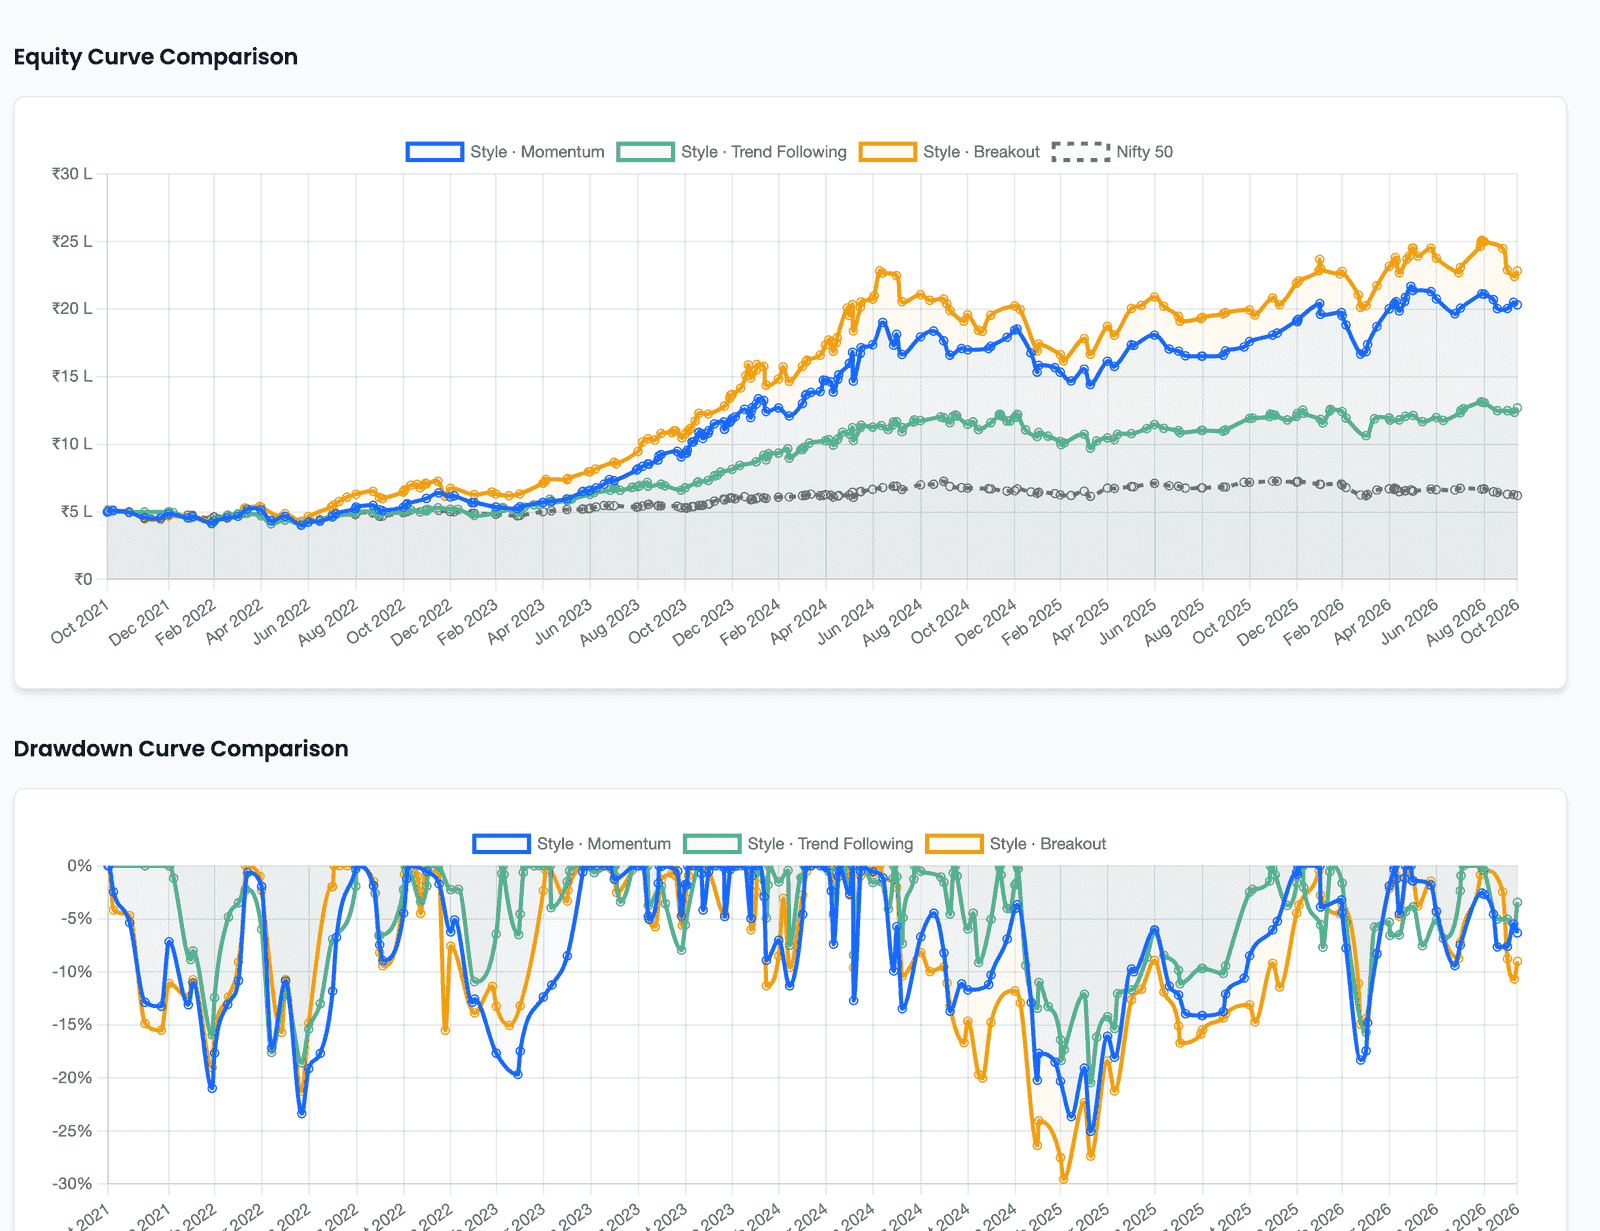
2022 — choppy and sideways for the broad market. The two fast styles made money: breakout nearly 42% and momentum about 24%. Trend following barely moved, at under 4%. That is consistent with its design: a long-trend condition and monthly reviews have little to confirm in a year without a clean trend.
2023 — a strong rising year. All three soared, from about 57% to over 100%. When everything rises that much, the result says more about the year than about the rules. The ordering matched 2022, but the gap between the styles mattered less than the tide under all of them.
2025 and 2026 so far — much harder. Every style slowed to single digits: under 7% in 2025, and between about 3% and 6.5% in 2026 to date. The ordering shuffled too — breakout led in 2025, momentum led in 2026 so far — and momentum had already led in 2024. Whatever advantage the fast styles showed in 2022 and 2023 did not carry forward as a fixed ranking.
No style leads every row
- Breakout had the highest CAGR and Sharpe — but also the deepest fall and the longest time underwater.
- Trend following had the smallest fall, the fewest trades and the longest holds — and the lowest return in every full year.
- Momentum sat between the two on most rows, and traded the most, at 319 trades.
The Key takeaway card at the top of Compare Results says the same thing in the product's words: "Style · Breakout has the highest CAGR and Sharpe; Style · Trend Following has the smallest worst fall." It is generated output describing one comparison over one window — notice that it names two strategies for two different things and does not pick between them.
That refusal is the honest reading. Which of these styles is "right" depends on what you could actually live with — a fall of nearly 30% and more than a year underwater, or a smaller fall and returns that lag in the good years — not on which column of this table looks largest.
Trade-offs
Responsiveness against churn
The weekly styles reacted faster and traded far more: 319 and 254 trades against 101. At 0.1% on every buy and sell, that difference is a real cost, and it compounds.
Smaller falls against upside
Trend following fell least and spent the shortest time underwater, but lagged in every full year. Waiting for confirmation can keep a strategy out of some declines and some rallies alike.
Weekly attention against monthly patience
A weekly strategy generates decisions every week. A monthly one asks you to wait four weeks while prices move, which takes a different kind of discipline.
Each style also has conditions it tends to handle badly, and they follow from the same logic that helped it elsewhere. The two fast styles hold what has risen most recently, so a sharp reversal tends to hit them hardest and soonest — and their longer drawdowns here are consistent with that. Trend following needs a trend to confirm, so a choppy market can leave it waiting, as 2022 did. Five years of history contain only a few of these episodes, which is too few to know how any of the three would fare in the next one.
Lessons learned
- Hold everything constant except the rules you are studying — then the comparison says something about style, and Compare Results has nothing to flag.
- Read Max Drawdown and Longest Drawdown Days before CAGR: the highest-returning style here also spent the longest time below a previous high.
- Always look at the year-by-year returns. One exceptional year, 2023, inflates every CAGR in this comparison.
- The fast styles did well in a choppy 2022 and trend following did not; in 2025 and 2026 all three slowed to single digits and the ordering shuffled.
- No style leads every row. Each one's strength on one metric came with a cost on another.
- Treat the Key takeaway and the Score band as the product's description of one backtest, not as a verdict on which style to use.
- Choose a style by the bad stretch you could sit through and the trading you can carry, not by the largest number in a single five-year window.