
Building a Long-Term Investing Strategy
A case study in turning "long-term" into concrete rules — from a Quick Strategy starting point to a Custom version — and then reading two very different backtests honestly, risk first, with one exceptional year in plain view.
What You’ll Learn
By the end of this article, you’ll understand:
- How to turn "long-term" into concrete rules
- What a Quick Strategy gives you as a starting point
- Which settings slow a strategy down, and what that costs
- How to judge a long-horizon result honestly
Objective
Picture a hypothetical investor with a long horizon — money they do not expect to need for many years. They are not trying to squeeze out the highest possible return. They want three things: broad exposure rather than a handful of bets, few trades, and the patience to let a holding drift for a while without reacting to every wobble.
"Long-term" is easy to say and hard to test, because a backtest cannot read intentions. It can only run rules. So the real objective of this case study is translation: turning a feeling about time horizon into settings a strategy can actually follow, and then judging the result by whether it behaved like a long-term strategy — not by how much it made.
Everything below is a hypothetical demo. The two strategies and their backtests were built to illustrate the method. They are not strategies to copy, and nothing here is a recommendation.
Approach
From an intention to a strategy you can judge
- State the goal in plain wordsBroad, few trades, tolerant of drift
- Start from a Quick StrategyA preset template, at no credit cost
- Read its resultRisk and behaviour first, return last
- Translate "long-term" into rulesOne setting per intention
- Build a Custom versionIn the Custom Strategy Builder
- Compare honestlyCheck what actually differs before believing the gap
Strategy design: the starting point
The first version, Steady Large Caps, is a Quick Strategy with Risk Level Conservative, Strategy Speed Slow and Rebalance Frequency Monthly. Those three choices fill in every other setting from presets: the Nifty 50 as the universe, 10 holdings, an Exit Rank of 20, the 200-day SMA, 9- and 12-month ROC, ranking on Volatility Adjusted Returns, a Slow Super Trend filter, and only stocks within 25% of their 52-week high. Like every Quick Strategy, it was backtested from 1 January 2021 with zero transaction cost, and it spent no Strategy credit.
Its result was modest, and the risk figures come first for a reason:
- its worst fall from a peak was −23.13%;
- its longest stretch below a previous high lasted 502 days — well over a year;
- it made only 53 trades in nearly six years;
- its CAGR of 7.95% sat just under the Nifty 50's 8.56% over the same period.
The results page gave it a Score of 51, labelled Moderate. None of this makes it a bad strategy. It does show that a Quick Strategy is a template, not a destination — a sensible set of slow, steady presets that nobody chose with this particular investor in mind.
Strategy design: translating "long-term" into rules
The second version, Long Horizon Core, was built in the Custom Strategy Builder so that each setting could be chosen for a stated reason. Every long-term intention maps to one control:
| Intention | Setting that expresses it |
|---|---|
| Follow slow trends, not short swings | 200-day SMA only |
| Measure momentum over one long window | 12-Month ROC only |
| Prefer steadier names | Ranking Method: Volatility Adjusted Returns |
| Ask for stronger confirmation | Super Trend Filter: Slow (Stronger Confirmation) |
| Spread the money more widely | 20 holdings from the broader Nifty 200 (Market Cap 5,000 Crores+, Liquidity 1 Crore+, within 30% of the 52-week high) |
| Tolerate drift before selling | Exit Rank 50 and Exit Delay Delay by 1 period |
| Make fewer decisions | Monthly rebalance, on the 1st |
| Count trading honestly | Transaction Cost 0.1% on each buy and sell |
Investment Mode was Reinvest, and no stop losses were set. The product's own description of the result reads "Top 20 from Nifty 200 · Monthly on 1st · 200 SMA · 12M ROC · Vol. Adj. Returns". It was backtested over the Last 5 years setting — 12 October 2021 to 12 October 2026.
Two details matter here. Exit Delay is measured in rebalance periods, not days, so on a monthly strategy "1 period" means a holding must stay below its exit threshold for an extra month before it is sold. And because this is a Custom Strategy, each backtest spends one Strategy credit, including every re-run after a Customize.
As with every NiveshBuddy backtest, signals come from the previous trading day's end-of-day data and trades are assumed to execute at the scheduled day's close — never intraday.
Review of outcome
Risk first: the two hypothetical demo backtests
Steady Large Caps (Quick)
- Max drawdown −23.13%
- Longest drawdown 502 days
- Volatility 15.44%
- 53 trades · avg hold 262 days
7.95%
CAGR, Jan 2021 – Oct 2026
Long Horizon Core (Custom)
- Max drawdown −18.23%
- Longest drawdown 188 days
- Volatility 18.74%
- 78 trades · avg hold 335 days
27.76%
CAGR, Oct 2021 – Oct 2026
Long Horizon Core's worst fall was smaller and its longest spell below a previous high far shorter. But its volatility was higher, so it was not calmer in every sense. And the headline CAGR needs the next table before it means anything.
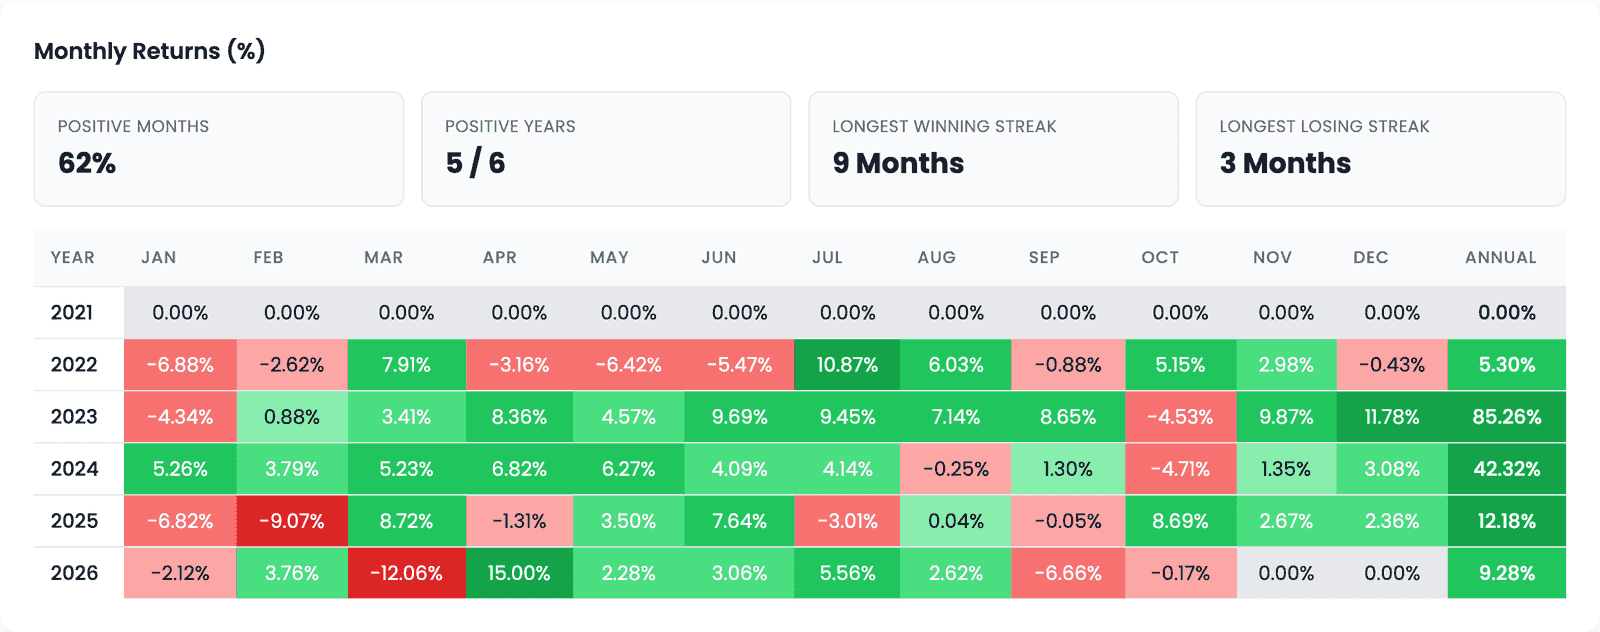
One year did most of the work
| Year | Long Horizon Core | Steady Large Caps |
|---|---|---|
| 2021 | 0.00% (started October) | 0.00% |
| 2022 | 5.30% | 0.74% |
| 2023 | 85.26% | 42.80% |
| 2024 | 42.32% | 16.79% |
| 2025 | 12.18% | 3.20% |
| 2026 (to October) | 9.28% | −10.36% |
2023 was an exceptional year for these kinds of stocks, and it inflates every CAGR in this article. Working from the annual figures, Steady Large Caps' other years taken together compound to only about 9% in total; Long Horizon Core's come to roughly 84% over about four years — still far below what its 27.76% headline suggests. The averages hide how uneven the path was: two flat starts, one extraordinary year, and then a steady fade, with Steady Large Caps losing ground in 2026.
None of these figures is a return anyone should expect to see again. They describe how two rule sets behaved on one stretch of history, based on available data.
What the Compare Results page does and doesn't say
Putting the two side by side in Compare Results, the generated Key takeaway reads "Long Horizon Core leads on every measure compared" — on its three fixed facts: the higher CAGR, the smaller worst fall and the higher Sharpe ratio (1.42 against 0.58). The same page warns against reading too much into that. A Comparison Quality: Medium banner says the results were tested over different periods, and the takeaway adds that their transaction cost assumptions differ.
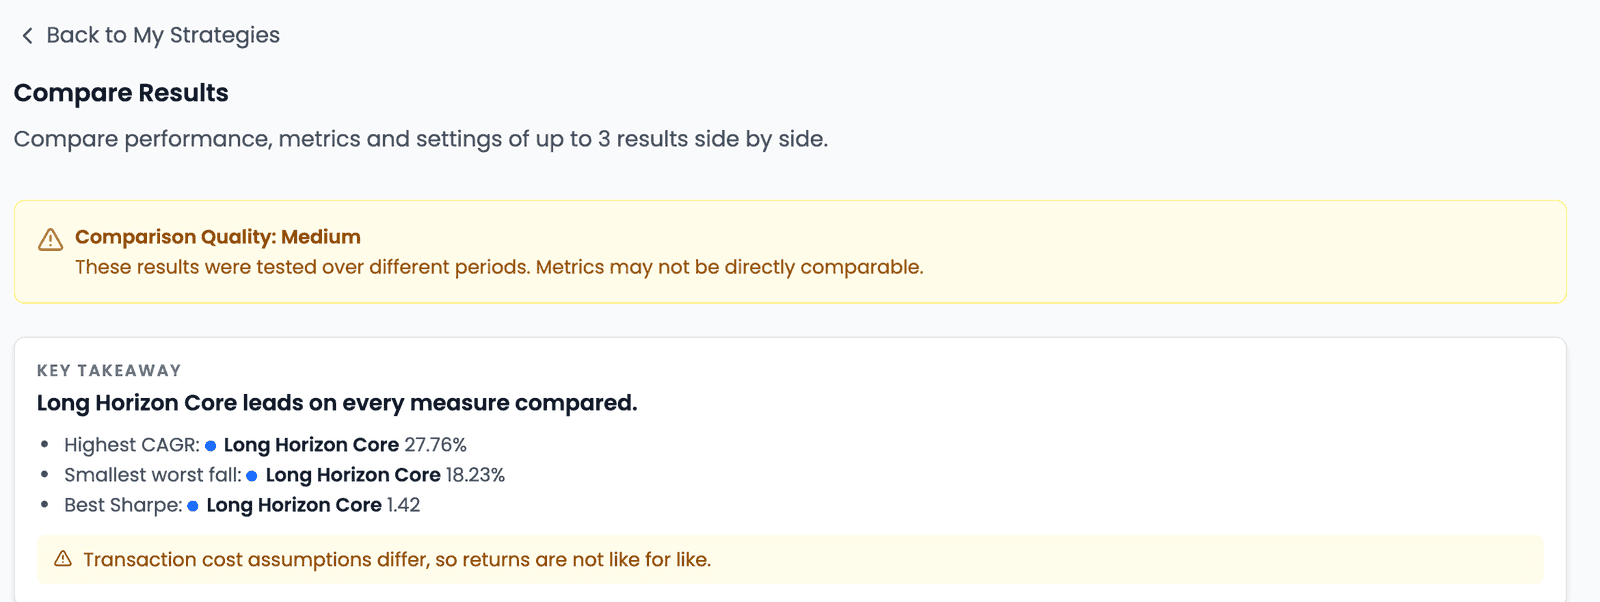
The page is right to warn. These two backtests differ in at least four ways at once:
- Different periods. Even the benchmark moved: the Nifty 50 returned 8.56% a year over Steady Large Caps' window and 4.45% over Long Horizon Core's. That gap is why one shows an Alpha of −0.62% and the other +23.32%.
- Different costs. Steady Large Caps ran with zero transaction cost; Long Horizon Core paid 0.1% on every buy and sell.
- Different universes. Nifty 50 against Nifty 200.
- Different holdings counts. 10 against 20.
So the comparison shows that these are two different strategies. It does not prove that one design is better. A fair next step would be to re-run Steady Large Caps' rules over the same five years at the same 0.1% cost — Save As to make a copy at no cost, then Customize to change its Backtest Period and Transaction Cost, which spends a Strategy credit. That test isn't performed here.
What does hold up
Some results don't depend on the comparison at all. Long Horizon Core traded little — 78 trades in five years across twenty holdings. It held positions for 335 days on average, and up to 941. Its worst fall and its longest time underwater were the smaller of the two. Those are the long-term behaviours it was designed for, and they followed directly from the rules in the table above.
The return level is the part least likely to repeat. A strategy built to be slow and patient can be judged on whether it was slow and patient; how much it earned in 2023 says more about 2023 than about the design.
Trade-offs
Fewer trades, slower reaction
Monthly rebalancing and long windows keep turnover and costs down, but the strategy responds late when a holding or the market turns.
Broader universe, more names
Twenty holdings from the Nifty 200 reduce concentration in any single stock, at the cost of more names to keep track of.
Patience includes holding laggards
A wide Exit Rank plus Exit Delay avoids selling on one bad month, which also means fading stocks are held for longer before they go.
Lessons learned
- Write "long-term" down as specific intentions — broad, few trades, tolerant of drift — before touching a setting.
- Map each intention to one control, so every setting has a reason you can state.
- Treat a Quick Strategy as a template: it is free to run and shows what slow, conservative presets do, but it was not built around your goal.
- Read risk first — the worst fall and the longest time below a previous high — before looking at CAGR.
- Look at the year-by-year returns; a single exceptional year can make a whole CAGR misleading.
- Check what differs before trusting a comparison: period, costs, universe and holdings count all moved here, and the Compare Results page said so.
- Judge a long-term design on whether it behaved like one; the return level is the part least likely to repeat.