
Mastering the Custom Strategy Builder
Five steps, and the decision each one is really asking. What a segment index changes, what Liquidity actually measures, why Exit Rank is set wider than your holdings, and why Exit Delay is counted in periods rather than days.
What You’ll Learn
By the end of this article, you’ll understand:
- When the Custom Strategy Builder earns its extra complexity
- Why a segment index is not simply a broader universe
- What Liquidity measures, and why the 20-day window matters
- How the Ranking Method decides what "best" means
- Why Exit Rank is normally set wider than the number of holdings
- Why Exit Delay is counted in periods rather than days
- How Customize and Save As differ, and which one spends a credit
When this is the right tool
Two ways to end up here. You have an idea the presets cannot express — a
particular slice of the market, or a specific view about what makes a stock worth
holding. Or you started with a quick strategy, pressed Customize, and landed
here with every preset filled in and editable. The second route is easier and more
common: reacting to a working configuration beats specifying one from scratch.
This is not the serious version of the builder. It is the version that asks more of you — five steps, each asking one kind of question, arriving in the order the strategy will actually use them.
One idea runs through all five: mid-sized companies rising steadily, held about fifteen at a time, tolerant of a bit of drift.
Step 1 — Universe & Filters
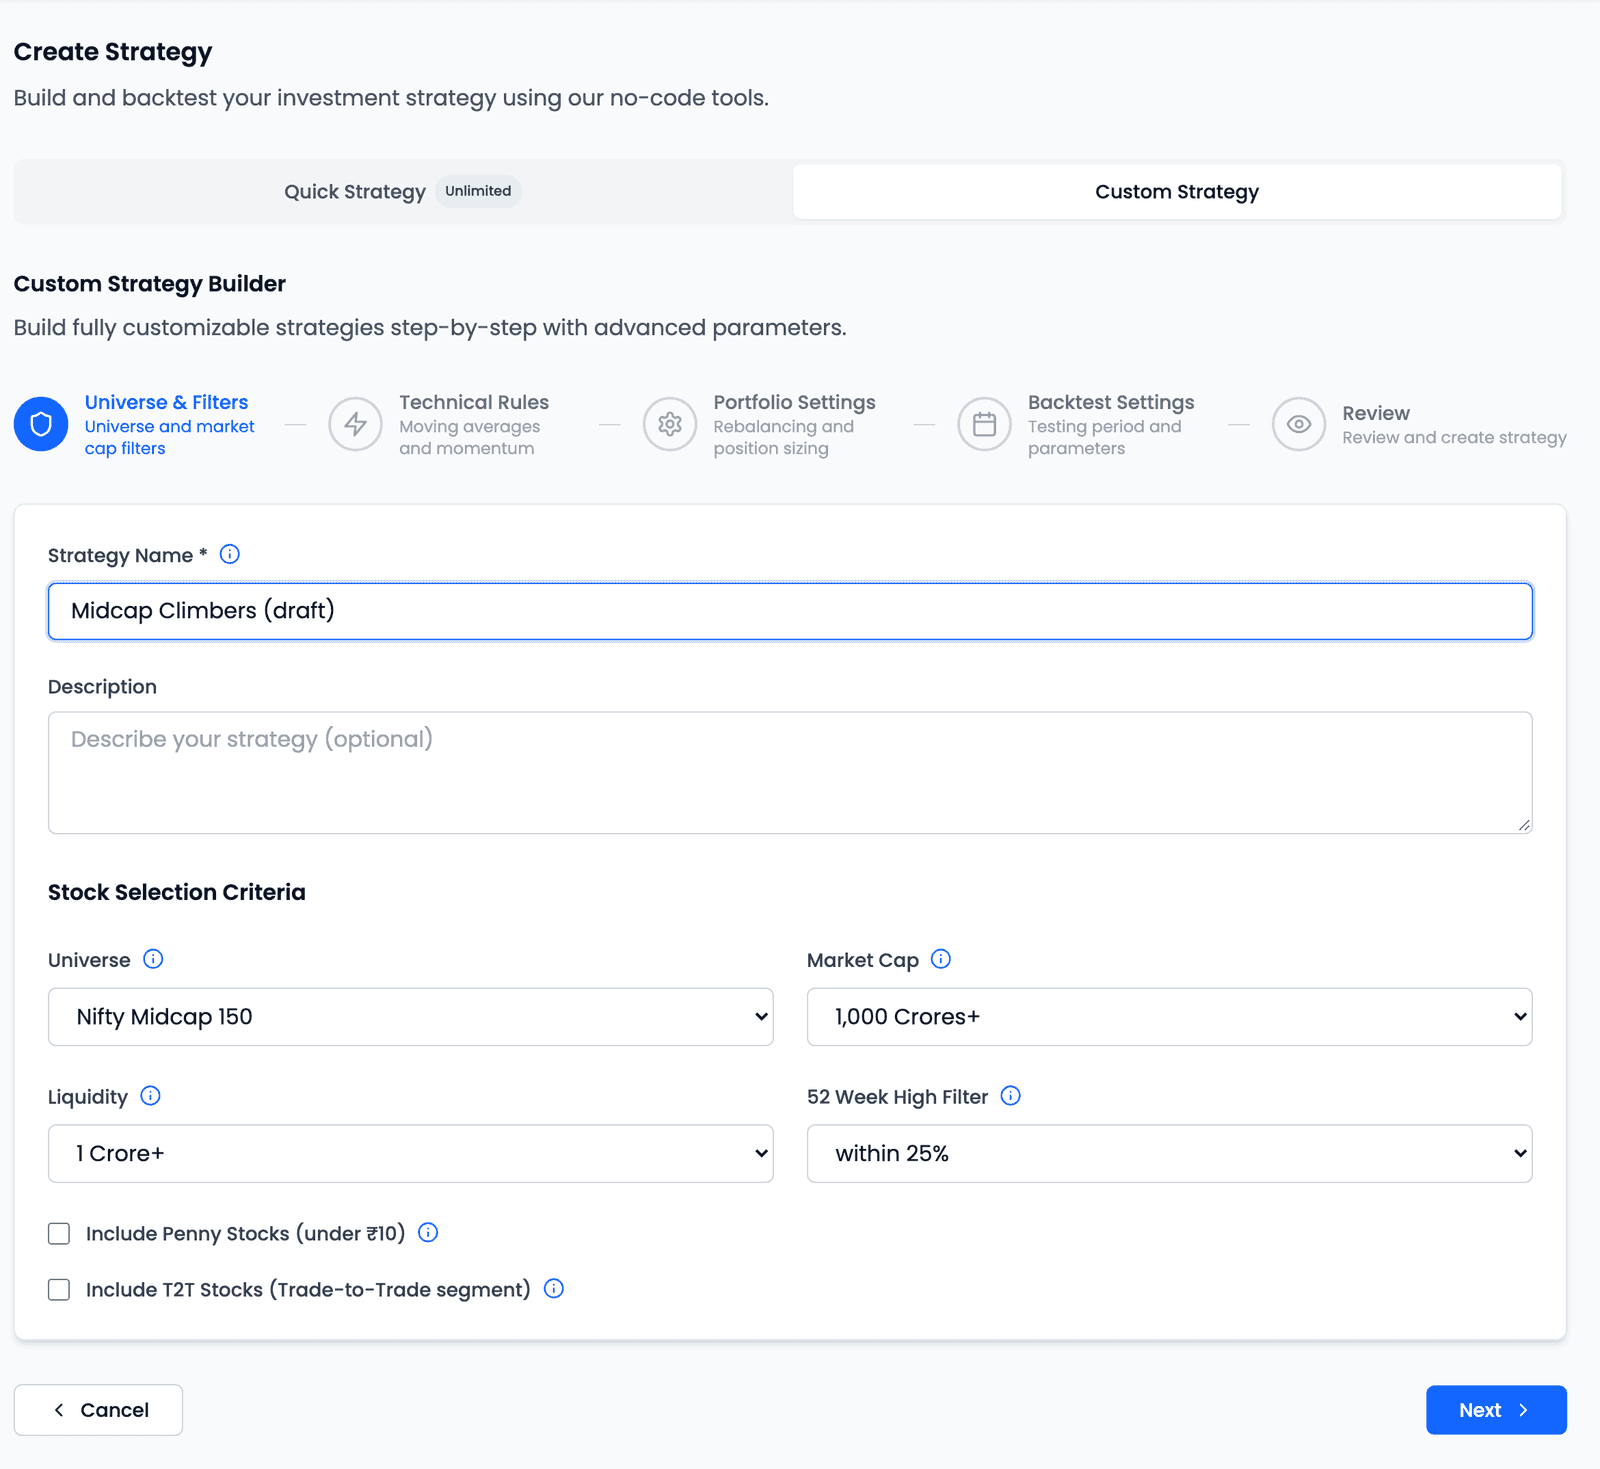
This step decides what the strategy may ever hold. Nothing later can rescue a stock excluded here.
Universe is the first and biggest choice — nine options, and they are not all
the same kind of choice. Five widen by size rank: Nifty 50, Nifty 100,
Nifty 200, Nifty 500, Nifty All. Four target a segment directly:
Nifty Midcap 150, Nifty Smallcap 250, Nifty MidSmallcap 400,
Nifty Total Market 750.
That distinction matters more than it looks. A segment index is not a broader
version of a rank index. Nifty Smallcap 250 is not "more market" than
Nifty 100 — it is a different part of it, with the larger companies removed
rather than added. Our running idea wants mid-caps specifically, so it takes
Nifty Midcap 150 rather than reaching for a bigger number.
Liquidity is worth understanding properly, because the label undersells it. It is 20-day average volume × price — an average daily traded value in rupees, over a rolling twenty-trading-day window. The averaging is the point: one unusually busy day does not make a thinly traded stock eligible, and a stock whose volume has quietly dried up stops qualifying without a separate rule.
| Control | What it does | Notes |
|---|---|---|
| Universe | The index or list the strategy draws from | Nine options; five by size rank, four by segment |
| Market Cap | A minimum company-size threshold | No Minimum · 500 · 1,000 · 5,000 · 10,000 Crores+ |
| Liquidity | Minimum average daily traded value | 20-day average volume × price: None · 50 Lakhs+ · 1 Crore+ · 1.5 Crores+ · 2 Crores+ |
| 52 Week High Filter | How far below its yearly peak a stock may be | within 5% to within 50% in 5% steps, or None |
| Include Penny Stocks | Admits shares under ₹10 | Unchecked by default, so these are excluded unless you opt in |
| Include T2T Stocks | Admits Trade-to-Trade securities | Unchecked by default; T2T must settle by delivery, so a buy cannot be sold the same day |
Both checkboxes are phrased as inclusions and start unticked — so the default is exclusion, and you widen the universe by opting in rather than switching a filter on.
Step 2 — Technical Rules
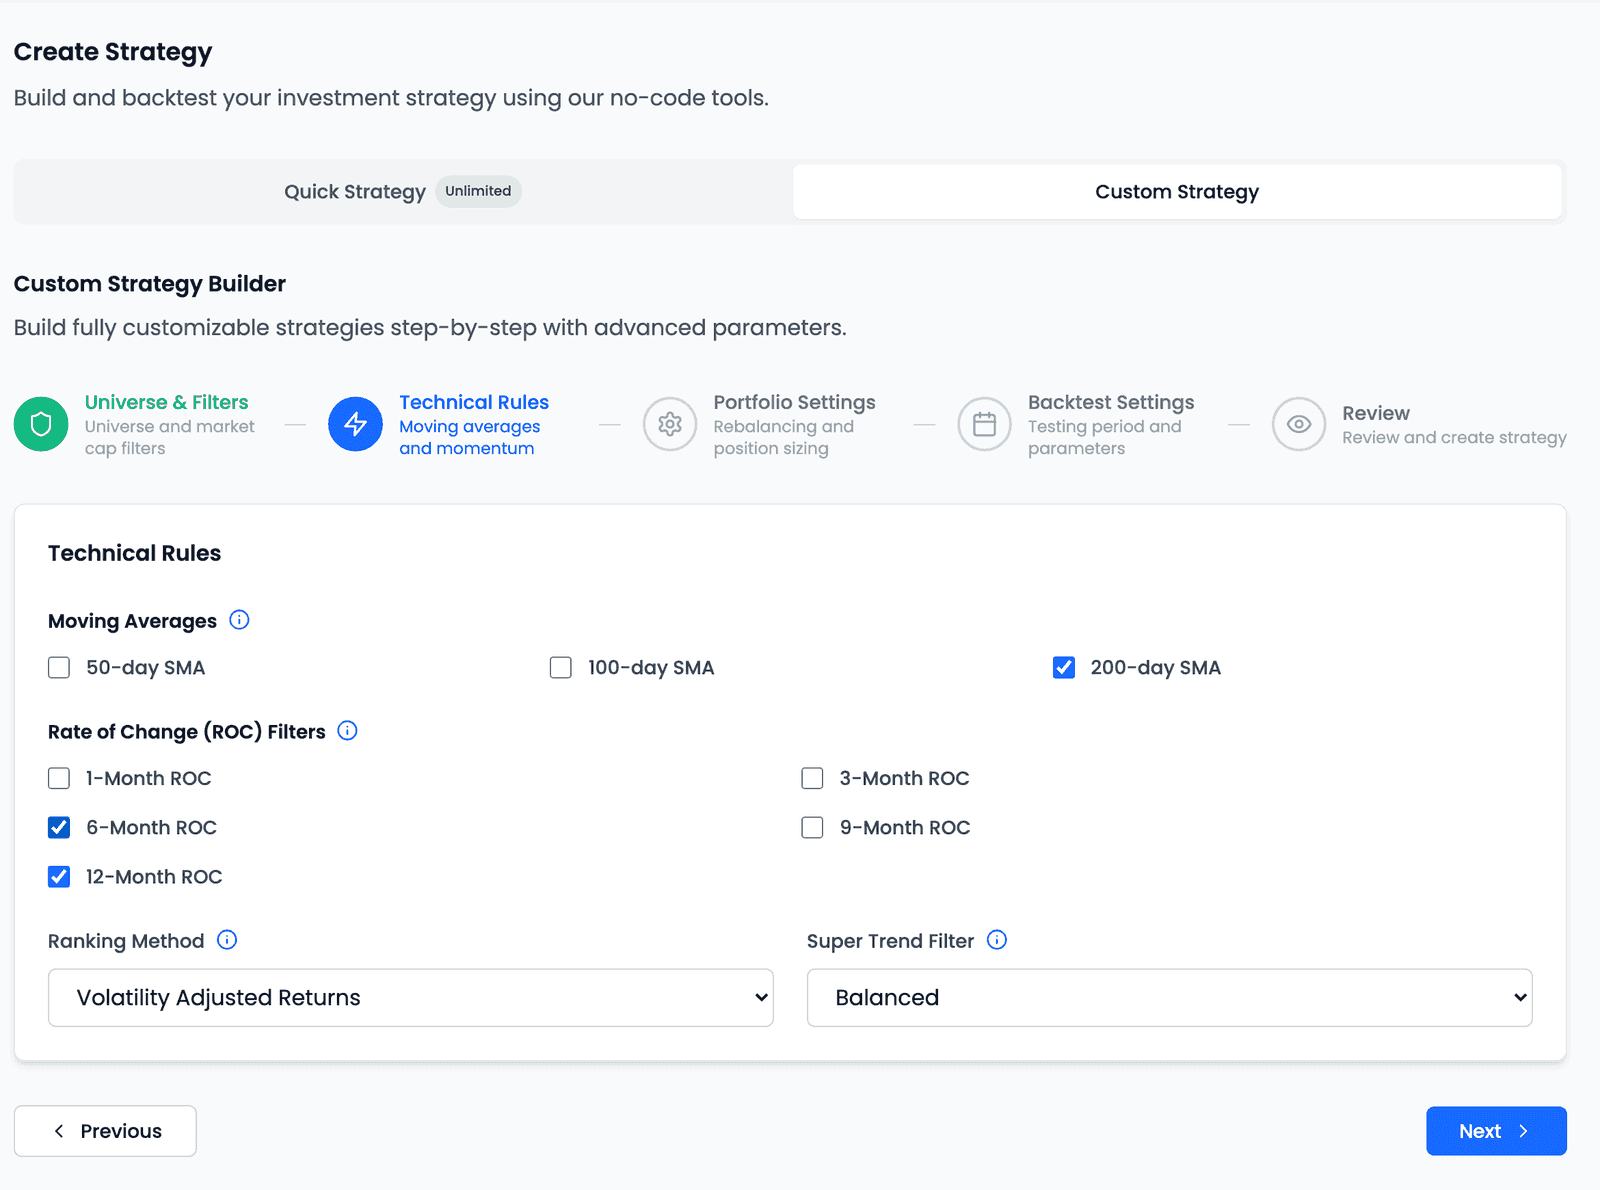
Step 1 said what may be held. This step says what looks worth holding.
Every setting in this step is optional
A strategy can be built with none of them selected. That is worth knowing before you start ticking boxes, because it reframes the step: you are not filling in a form, you are choosing which conditions you actually want to impose.
Moving Averages offers 50-day, 100-day and 200-day SMA, and you may
select more than one. These are simple moving averages — the builder offers no
other type. Rate of Change (ROC) Filters offers 1-Month, 3-Month,
6-Month, 9-Month and 12-Month windows, and despite the name it ranks rather
than filters: tick several and the universe is ranked once per window, then each
stock's ranks are averaged. A new Custom strategy starts with the 50- and 200-day
SMA and the 6-Month ROC ticked — defaults you are free to clear.
What each measures, and why combining too many causes trouble, is the subject of its own article. What matters here is that they are yours to choose.
Ranking Method deserves more attention than it gets. Two options,
Absolute Returns and Volatility Adjusted Returns, answering a question no
other control does: once you have a set of eligible stocks, what does best mean?
Absolute Returns means the one that rose most. Volatility Adjusted Returns
means the one that rose most for the amount it moved around getting there. Run the
same eligible set through both and you get two different portfolios from
identical filters — the second will tend to prefer steadier climbers, the first
the sharpest movers.
Our running idea says steadily, so it takes Volatility Adjusted Returns. That
single dropdown does more to shape the resulting portfolio than most of the
checkboxes above it.
| Control | Options | Notes |
|---|---|---|
| Moving Averages | 50-day, 100-day, 200-day SMA | Multiple allowed; simple moving averages only |
| Rate of Change (ROC) Filters | 1-, 3-, 6-, 9-, 12-Month | Multiple allowed; ranks are averaged across ticked windows |
| Ranking Method | Absolute Returns · Volatility Adjusted Returns | Decides what "best" means when ordering |
| Super Trend Filter | None · Fast (More Reactive) · Balanced · Slow (Stronger Confirmation) | The naming carries the trade-off |
Step 3 — Portfolio Settings
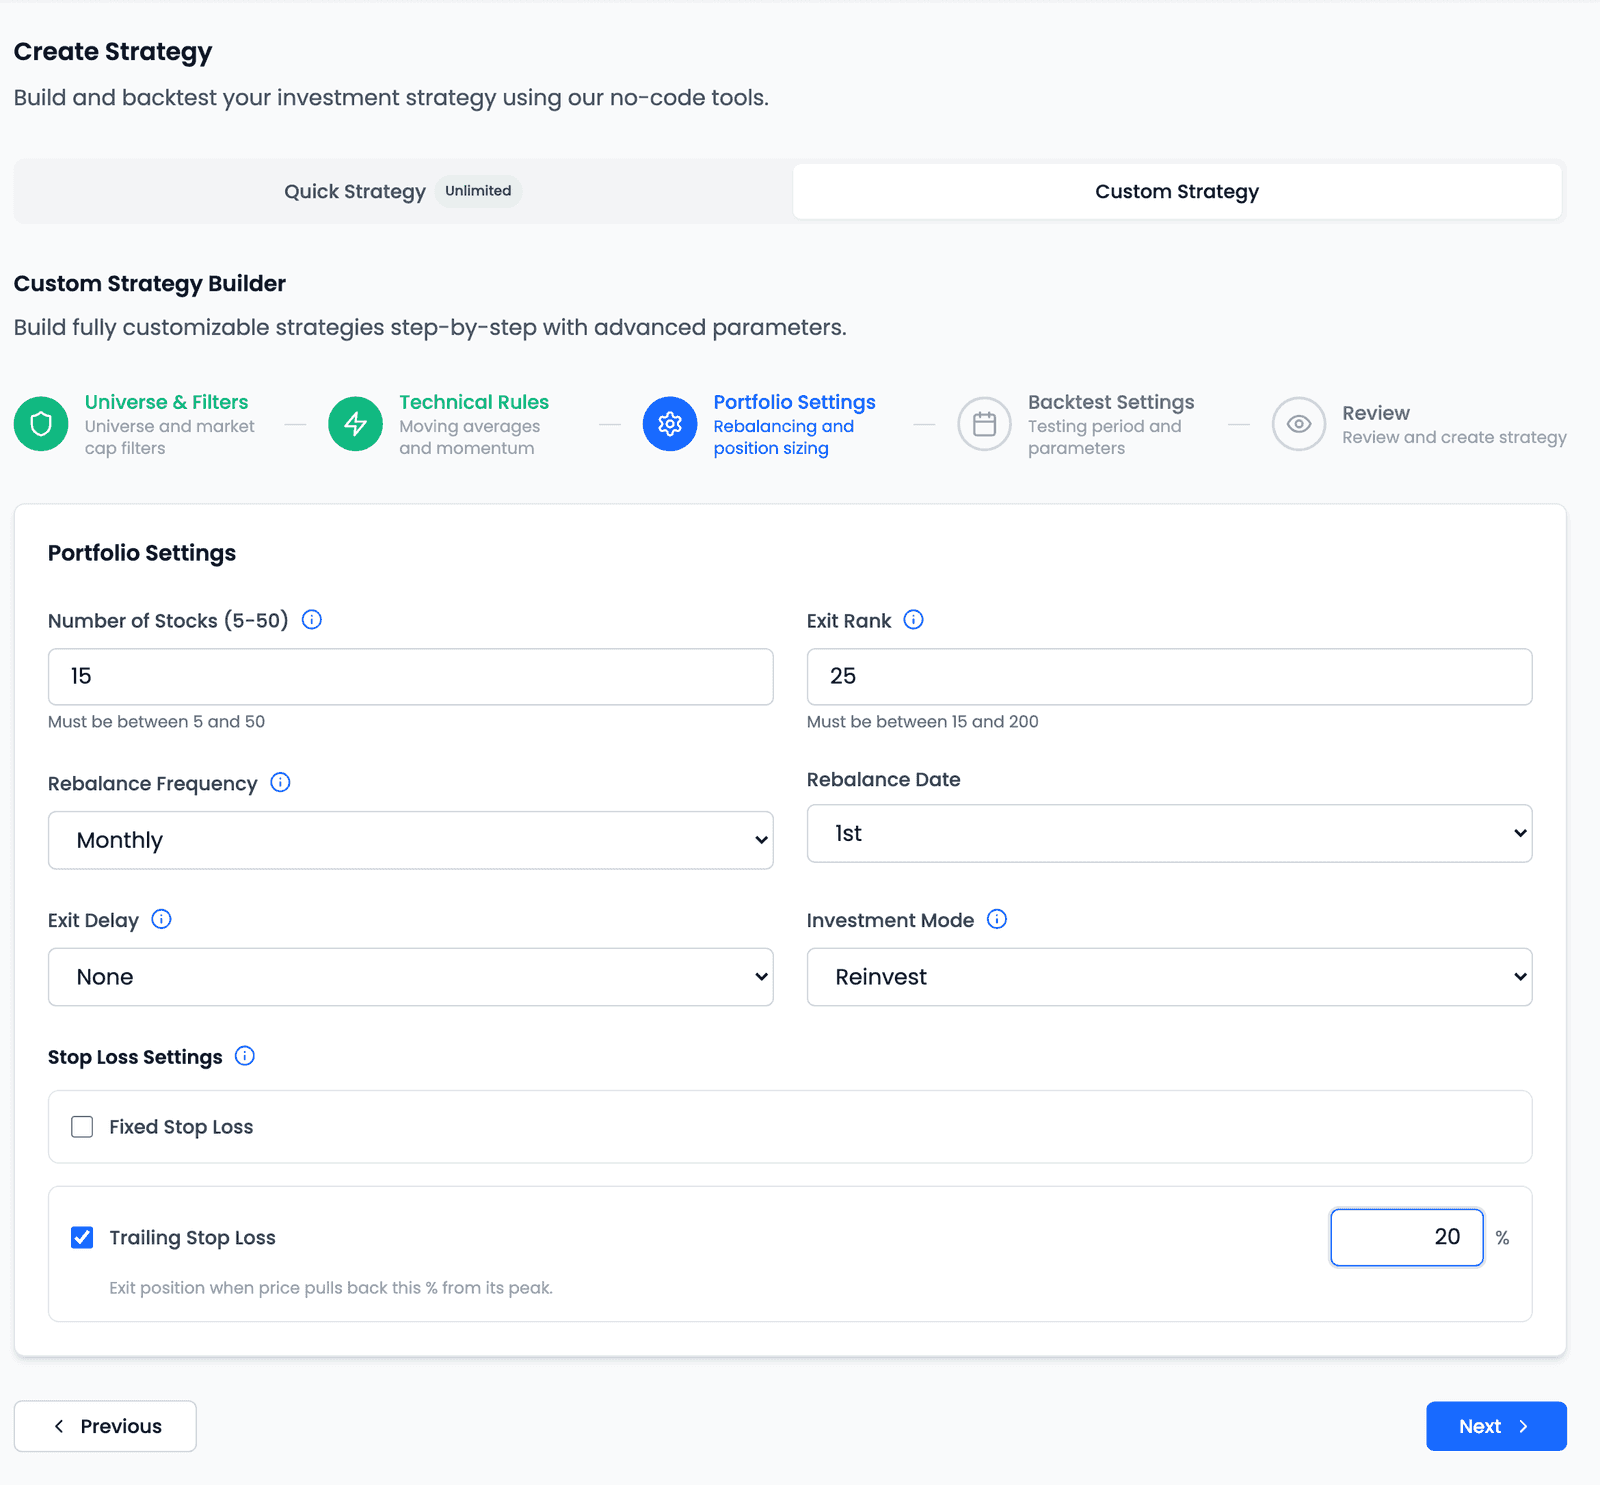
Ranking produces an order. This step decides how far down it to go, and what makes a holding leave.
Number of Stocks and Exit Rank work as a pair. Number of Stocks runs from 5 to 50; Exit Rank runs from your Number of Stocks up to 200, so it can never be tighter than the holdings count. The helper text under the field follows whatever you set: with 5 stocks it reads "Must be between 5 and 200", with 15 it reads "Must be between 15 and 200". It is normally set wider: a strategy holding the top 15 with an Exit Rank of 25 tolerates a stock slipping to 16th, and lets go only once it falls past 25th.
That gap is the design decision. Close together, the strategy sells on small ranking movements and trades more. Far apart, it holds positions well past the point they stopped being among its best ideas. Our running idea says tolerant of drift, so 15 and 25 fits.
Exit Delay is the setting most likely to be misread. Its options are None,
Delay by 1 period, Delay by 2 period and Delay by 3 period — and a period
is the strategy's own rebalance cycle, not a day. "Delay by 1 period" on a
monthly strategy is a month; on a daily strategy it is a day. Same setting, wildly
different behaviour, and nothing on the screen tells you which.
Rebalance Frequency comes with a second control that depends on it — a
Rebalance Day (Monday to Friday) for Weekly and Fortnightly, a Rebalance
Date (1st to 31st) for Monthly, and nothing for Daily. Two otherwise identical strategies rebalancing on
different dates will produce different historical results, which is worth
remembering before reading much into a small difference between two backtests.
| Control | Options or range | Notes |
|---|---|---|
| Number of Stocks | 5–50 | The product's stated range |
| Exit Rank | Number of Stocks to 200 | Normally set wider than Number of Stocks |
| Rebalance Frequency | Daily · Weekly · Fortnightly · Monthly | Weekly/Fortnightly add a Rebalance Day; Monthly a Rebalance Date |
| Exit Delay | None · 1, 2 or 3 periods | Periods, not days |
| Investment Mode | Reinvest · Fixed | Reinvest compounds proceeds into later positions |
| Stop Loss Settings | Two independent checkboxes | Both off unless you turn them on |
Stop losses are a subject in their own right — what each measures from, and why a NiveshBuddy stop is a rule checked on a close rather than an order resting in the market, is covered separately.
Step 4 — Backtest Settings
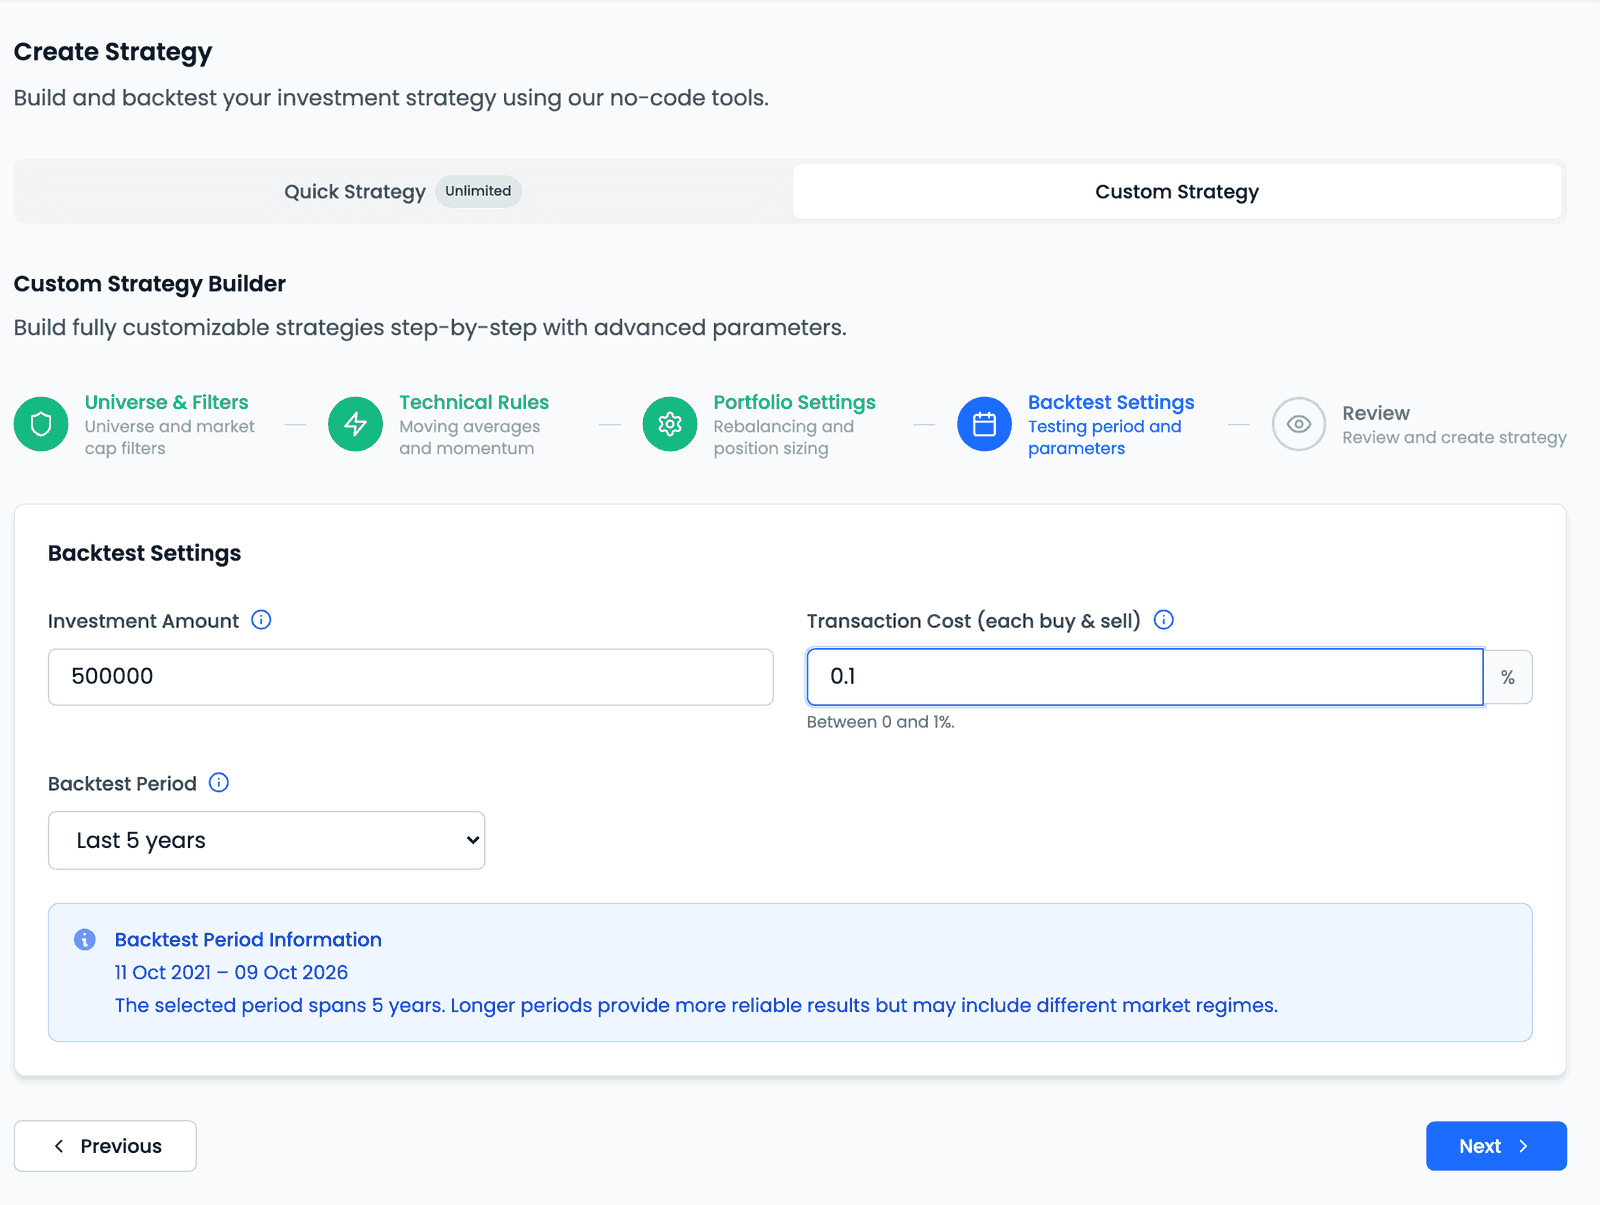
Three settings: an Investment Amount (₹5,00,000 by default, at least ₹10,000), a Transaction Cost, and a Backtest Period. Two of them deserve a second look.
Transaction Cost (each buy & sell) is a percentage, between 0 and 1%, and
defaults to 0. It is charged on every buy and every sell, so a round trip
pays it twice. It is your assumption about your own costs — not a NiveshBuddy
fee, and not a figure the platform charges or recommends. Leaving it at zero is a
choice too, and it means the result you are about to read assumes trading is free.
The Backtest Period decides what "tested" means. It offers Last 1 year,
Last 5 years and Custom (start and end dates appear only on Custom, and only
trading days can be picked). How far back you can go depends on your plan, and
NiveshBuddy's history begins in 2021. A Backtest Period Information panel
comments on your choice as you make it:
The selected period spans 5 years. Longer periods provide more reliable results but may include different market regimes.
That second clause is the honest half. A longer window is not simply better — it is more evidence and a mixture of conditions the strategy may have handled very differently. A window containing only a rising market tells you little about a falling one, so our running idea accepts a span long enough to include a bad stretch.
Step 5 — Review
The last step reads the configuration back, and it is worth reading rather than clicking past. This is the only place the whole specification appears at once — steps 1 to 4 each show a slice, and a contradiction between slices is far easier to spot here. A tight universe with a high holdings count, say, or a fast Super Trend Filter on a monthly rebalance.
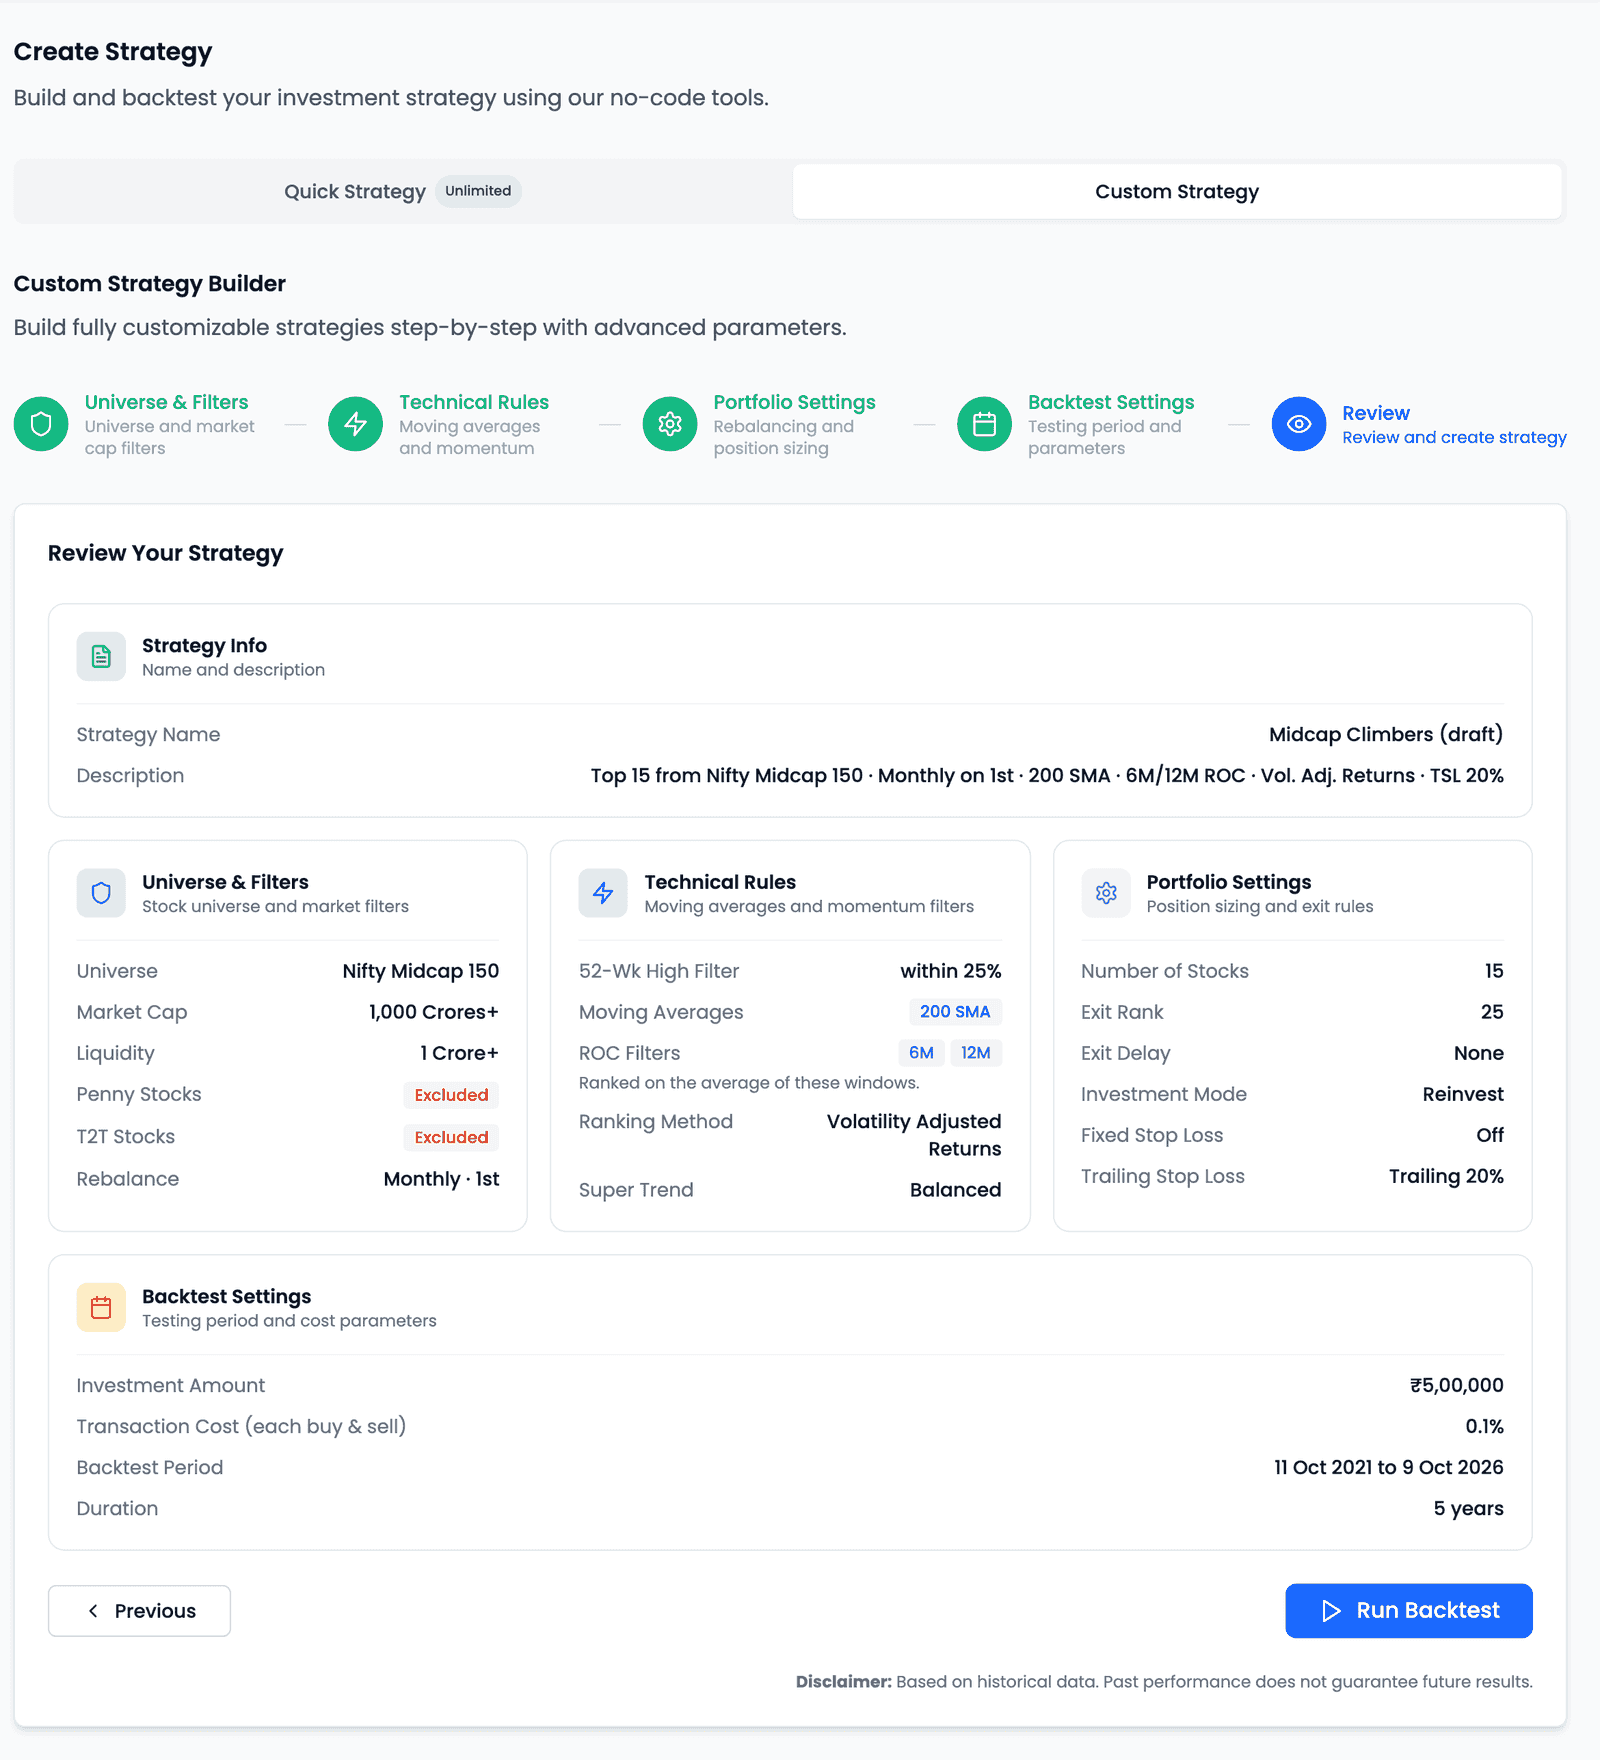
If you left the Description empty, the builder writes one for you — a one-line summary of the rules, like the one above, which becomes the strategy's subtitle on its results page. The ROC row also says how several windows are used: "Ranked on the average of these windows."
Its Run Backtest button creates the strategy and runs its backtest in one action. Every backtest from this builder spends one Strategy credit, so the app asks you to confirm first and shows how many you have left this month. What that backtest can and cannot tell you is a separate question, and the more important one.
Coming back to it: Customize and Save As
A strategy is rarely right the first time, and you change it from its results page or its card on My Strategies.
Customize reopens it in this builder, titled Customize Your Strategy, with every setting as you left it. Two things are different: there are no Quick and Custom tabs, and the name is fixed. The final button reads Update & Run Backtest, and because it is a Custom backtest it spends one Strategy credit, after the same confirmation. The new run becomes the strategy's current result; the earlier one is kept in its Backtest History, where the two can be compared side by side.
Save As is the other route: it copies the strategy under a new name, at no cost, and leaves the original untouched. Use it when you want to keep both versions as separate strategies rather than as two runs of one. Either way, change one thing at a time — it is the only way the comparison afterwards can tell you what the change did.
Two ways to get this wrong
Worth knowing before you build
There are no fundamental filters
Every control here is technical or price-based — index membership, size, tradability, moving averages, rate of change, trend. There is no P/E, ROE, ROCE, earnings, revenue or debt filter anywhere in the builder, and a strategy cannot be built on one.
More conditions is not more rigour
Every filter and indicator you add narrows the eligible set, and several stacked together can narrow it to almost nothing — or to a handful of stocks that happen to fit the past. A small number of rules you can explain is usually the better strategy.
Key takeaways
- The Custom Strategy Builder is not the serious version — it is the one that asks more of you, and Customize is the most common way to arrive at it.
- The five steps run in the order the strategy uses them: what may be held, what looks good, how much and how often, what to test against, then review.
- A segment index is not a broader universe — Nifty Smallcap 250 is a different part of the market, not more of it.
- Liquidity is 20-day average volume × price, and the averaging window is the point: one busy day does not qualify a thinly traded stock.
- The penny-stock and T2T controls are inclusions that start unticked, so the default is exclusion and you opt in to widen.
- Every setting in the Technical Rules step is optional — a strategy can be built with none of them.
- Ranking Method decides what "best" means: the same eligible set ranked two ways produces two different portfolios.
- Exit Rank is normally set wider than Number of Stocks, and the gap between them is how much ranking drift the strategy tolerates.
- Exit Delay is counted in periods — the strategy's own rebalance cycle — not in days.
- Transaction Cost is your assumption about your own costs, charged on each buy and each sell — not a platform fee — and the default of zero assumes trading is free.