
Improving an Investment Strategy
A case study in changing one rule for one reason, comparing the result fairly — and then checking whether the improvement survives a period it was not found on. It mostly didn't, and that is the useful part.
What You’ll Learn
By the end of this article, you’ll understand:
- How to turn a weakness in a backtest into a testable hypothesis
- Why you change one rule at a time
- How to compare two runs so only that rule differs
- How to check whether an improvement survives a different period
- When to stop tweaking
Objective
Every strategy can be made to look better on its own history. Change a setting, re-run, keep the change if the number went up — repeat that enough times and the backtest will improve without the strategy improving at all.
So this case study sets a stricter goal. An improvement here means a change you can explain before you see the result, that makes a difference you can attribute to it, and that still holds on a stretch of history it was not found on. A higher CAGR alone does not qualify.
Everything below is hypothetical and illustrative — a demo strategy and its backtests, used to show the method, not a strategy to copy or a recommendation.
Approach
One change, one reason, one fair comparison
- Read the evidenceName one specific weakness in the backtest
- Form a hypothesisWhich rule causes it, and what changing it should do
- Change one ruleCustomize — and nothing else
- Compare the two runsOnly that rule should differ
- Test another periodDoes the difference survive history it wasn't found on?
- Keep or rejectOn the evidence, not on the headline
Strategy design: the starting point
Midcap Climbers is a Custom strategy built in the Custom Strategy Builder: the fifteen highest-ranked stocks of the Nifty Midcap 150 by 6- and 12-month momentum, ranked on volatility-adjusted returns, rebalanced monthly, with a 20% Trailing Stop Loss and a 0.1% transaction cost on every buy and sell. Its first backtest, from October 2021 to October 2026, used an Exit Rank of 25 — a holding is sold once it slips below 25th place.
The result was respectable — a CAGR of 17.83% — but one figure stood out on the Performance tab: 233 trades in five years, for a portfolio of fifteen. That is a lot of turnover for a monthly strategy, and with a 0.1% cost on every buy and sell, each of those trades costs something real.
That gave a specific hypothesis: the strategy lets go of holdings too early. The rule responsible is Exit Rank. Widening it from 25 to 30 should let a holding drift a little further before it is sold — cutting trades without changing what the strategy buys. What it should not obviously do is change the return much; if it did, that would itself need explaining.
Review of outcome: the full window
The change was made with Customize on the strategy's results page: Exit Rank from 25 to 30, nothing else, then Update & Run Backtest — a Custom backtest, so it spent one Strategy credit. The new run became the strategy's current result, and the original stayed in its Backtest History.
Ticking both runs there and pressing Compare selected gives the fairest comparison the product offers — and the Settings section, which shows only what differs, proves it:
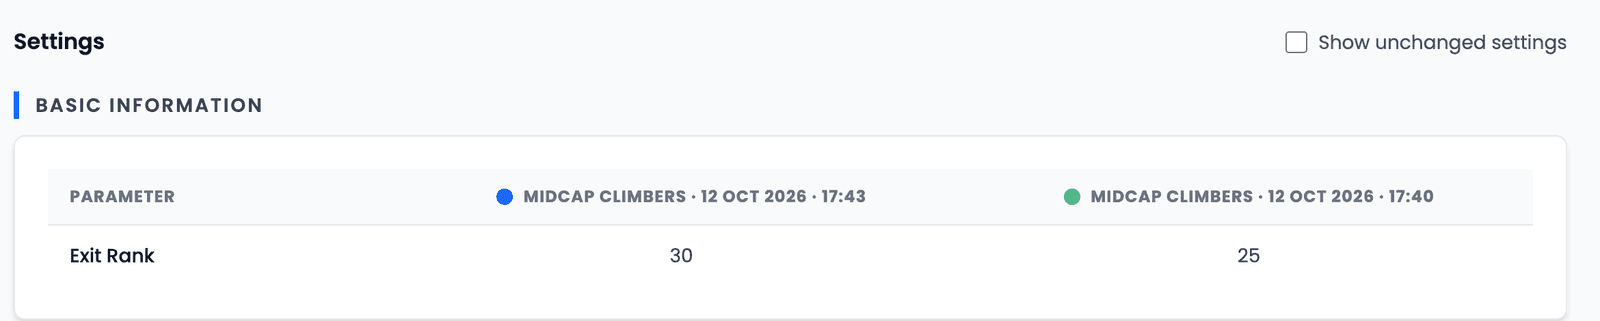
One row. Whatever separates these two results came from Exit Rank.
Exit Rank 25 against 30, October 2021 – October 2026
Exit Rank 25 (original)
- 233 trades
- Max drawdown −25.89%
- Score 75
17.83%
CAGR
Exit Rank 30 (changed)
- 212 trades
- Max drawdown −26.02%
- Score 80
18.50%
CAGR
On the full window, the hypothesis looks confirmed and then some: fewer trades, as predicted — and a higher CAGR and Score as a bonus. This is exactly the point at which most improvement loops stop. It is too early.
Review of outcome: does it survive another period?
Both versions were tested over the same five years the change was judged on. To see whether the gain belonged to the rule or to that stretch of history, each version was re-run on two halves of the window separately. (Save As made two copies at no cost, and Customize set each copy's Backtest Period to Custom dates — two more Custom backtests per copy.)
| Version | October 2021 – December 2023 | January 2024 – October 2026 |
|---|---|---|
| Exit Rank 25 | CAGR 25.01% · 91 trades · Max DD −19.75% | CAGR 14.61% · 127 trades · Max DD −25.75% |
| Exit Rank 30 | CAGR 22.80% · 78 trades · Max DD −20.95% | CAGR 14.70% · 117 trades · Max DD −25.75% |
Read across the rows and the full-window story comes apart.
- The return gain did not hold. In the first half, the original rule did better — by more than two points a year. In the second half the two are effectively level: 14.61% against 14.70%, with the same drawdown, Score and Sharpe.
- The reduction in trading did hold. Exit Rank 30 traded less in both halves — 78 against 91, and 117 against 127.
So the honest conclusion is narrower than the full window suggested. The change does what the hypothesis said it would: it trades less. The extra CAGR was a property of how those particular five years happened to line up, not of the rule. Kept for the right reason — lower churn, and so lower real-world costs — the change stands. Kept for the CAGR, it would not.
A second opinion from an Experiment
On plans that include it, an Experiment can vary several settings at once. One run on Midcap Climbers varied its ROC windows and holding count:
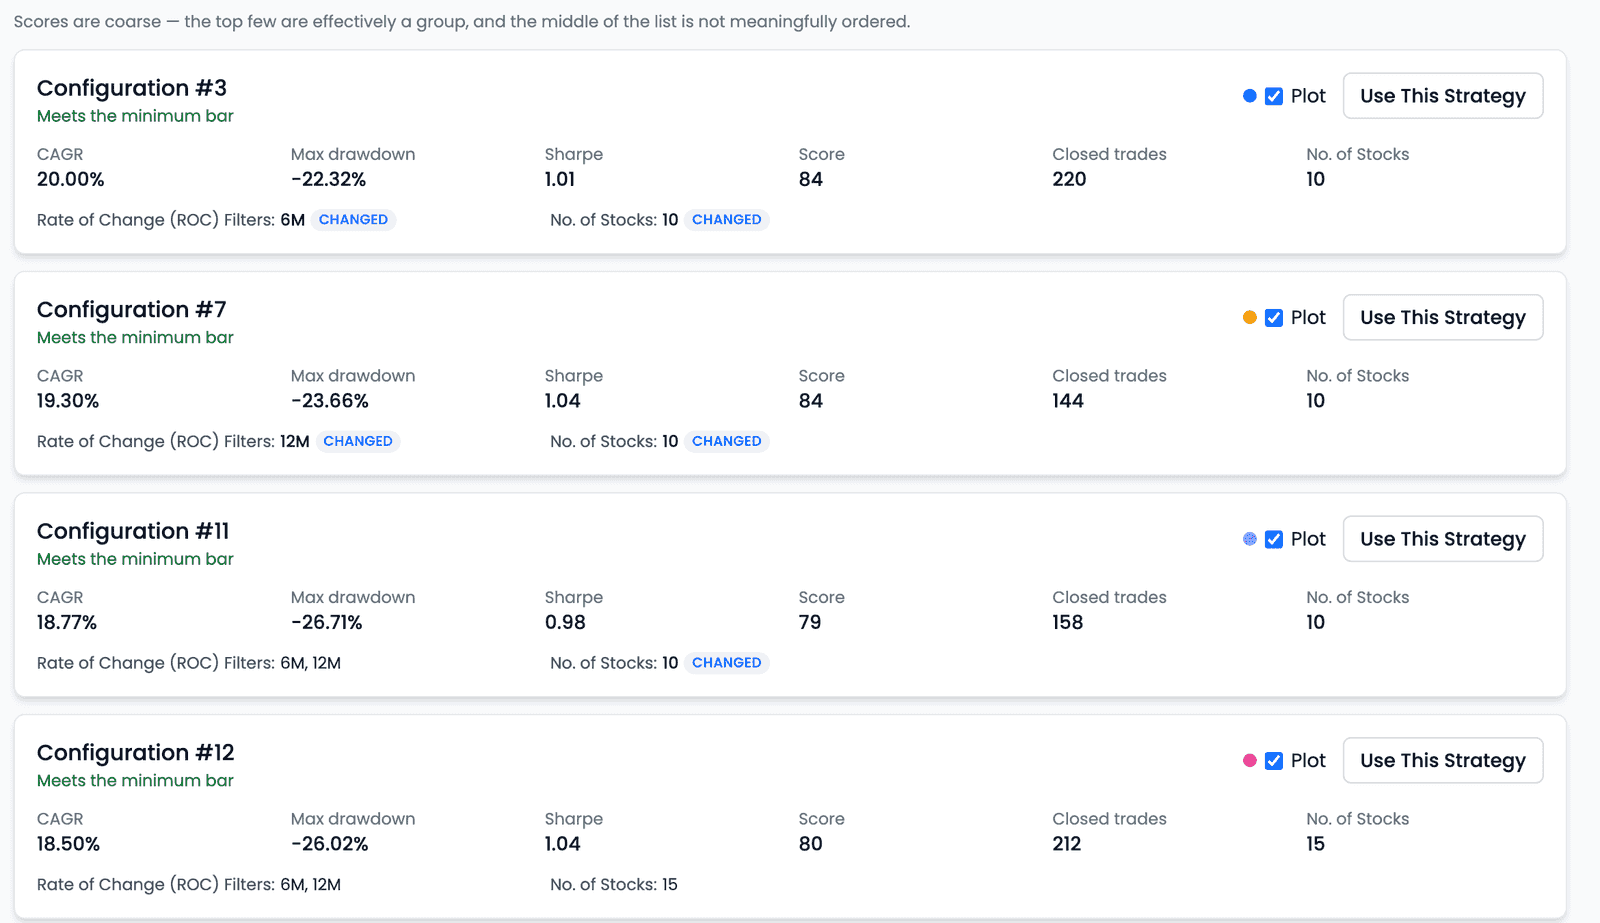
Its useful output is not the configuration that came first but the pattern: the top three all held ten stocks, whichever ROC window they used. That is a new hypothesis — a tighter portfolio suits this universe — and it deserves exactly the treatment above: one change, one fair comparison, then a period it was not ranked on. An Experiment proposes; it does not prove.
Trade-offs
Fewer trades, longer holds
A wider Exit Rank cuts turnover and real costs, but holds onto stocks that are fading for longer. Whether that suits you depends on what you pay per trade and how much drift you can tolerate.
One window is one sample
A difference of a point or so in CAGR over a single period is weak evidence. Splitting the window costs nothing in rules and often changes the answer, as it did here.
Every round spends unseen data
Each time you test on a new stretch of history and adjust, that stretch stops being out-of-sample. With history from 2021, there isn't much of it to spend.
When to stop tweaking
Stop when the reason runs out
Stop when the next change has no reason beyond "the number might go up". Stop when the differences you are chasing are smaller than the gap between two halves of the same window — here, a few tenths of a point against a swing of more than two. And stop when you have used up the history you have not yet looked at; after that, further improvements are mostly improvements to the fit.
At that point the better next step is not another backtest. It is a simulation — a paper portfolio run with virtual money — where the strategy meets conditions no backtest has seen. Historical results, however carefully tested, do not guarantee future performance, and what you do with a strategy remains your decision.
Lessons learned
- An improvement is a change you can explain in advance, attribute to one rule, and see hold on a period it was not found on — not a higher number.
- Start from one specific weakness in the evidence; here, 233 trades for a fifteen-stock portfolio pointed at Exit Rank.
- Change one rule with Customize, then compare the runs from Backtest History so the Settings section shows a single differing row.
- The full window said the change improved CAGR; the two halves said it didn't — the gain belonged to the window.
- What survived in both halves was the effect the hypothesis predicted: fewer trades.
- An Experiment's pattern is a hypothesis to test the same way, not a result to adopt.
- Stop when the reason runs out, when the gains are smaller than the noise, or when you have spent your unseen history — then simulate.