
Exploring Strategy Variations with Experiments
An Experiment backtests many variations of one strategy in a single run and ranks them. Used well, it tells you whether a result survives a nudge. Used badly, it hands you the configuration that best fitted the past and calls it first.
What You’ll Learn
By the end of this article, you’ll understand:
- What an Experiment does, and which plans include it
- How the settings you tick turn into configurations
- How to read a ranked result
- Why the first-ranked configuration is a lead to test, not an answer
What an Experiment does
A backtest answers one question: how did this set of rules behave? An Experiment asks a wider one: how would nearby sets of rules have behaved? It takes one of your strategies — the starting strategy — varies the settings you choose, backtests every resulting combination in a single run, and lists them ranked by the measure you pick. Each tested combination is a configuration.
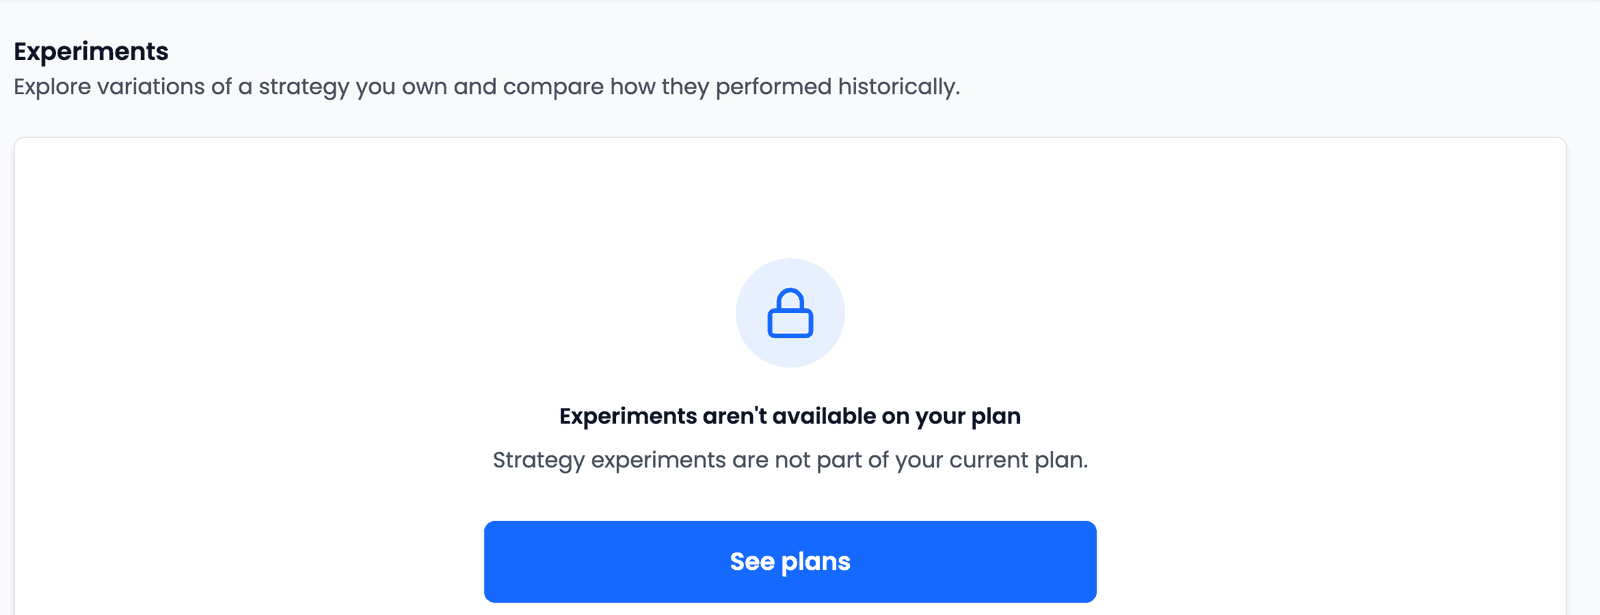
Experiments depend on your plan; the Pricing page shows which plans include them. If yours does not, the Experiments page says so and offers See plans.
When it's worth running
An Experiment is most useful after you have a strategy you understand — one you have backtested, read, and could explain in a sentence. Its job then is to answer a specific doubt: would this result survive a small change? If six-month momentum worked, do three- and twelve-month windows point the same way? If fifteen holdings worked, what happens at ten?
It is least useful as a search for something better. Ranking many configurations on the same history will always produce a first place, whether or not anything durable sits behind it. The rest of this article is about reading the list so that doesn't fool you.
Setting one up
From a starting strategy to a lead worth testing
- Pick a starting strategyExplore Variations on a strategy, or New Experiment
- Choose what to varyTick the options to try; anything left unticked keeps the strategy's own value
- Check the estimateHow many configurations, and roughly how long
- Run itEvery configuration is backtested
- Read the rankingLook for agreement, not a winner
Start from the strategy. Press Explore Variations on a strategy's results page or its card on My Strategies, or New Experiment on the Experiments page and pick one. By default the experiment uses the starting strategy's own test period; you can set different dates. The universe and its filters apply to every configuration.
Then choose what to vary. Each setting lists the values you can try, and says how your ticks combine:
| Setting | How ticked options combine |
|---|---|
| Rate of Change (ROC) Filters · Moving averages | Every combination of the ticked options is tried |
| Ranking method · Super Trend Filter · No. of Stocks · Maximum Rank · near 52-week high | Each ticked option is tried on its own |
| Position stop-loss · Trailing stop-loss | Each ticked option on its own, up to four per setting |
The two rules multiply. Ticking three ROC windows gives seven combinations — each window alone, each pair, and all three. Ticking two holding counts on top doubles that: 14 configurations.
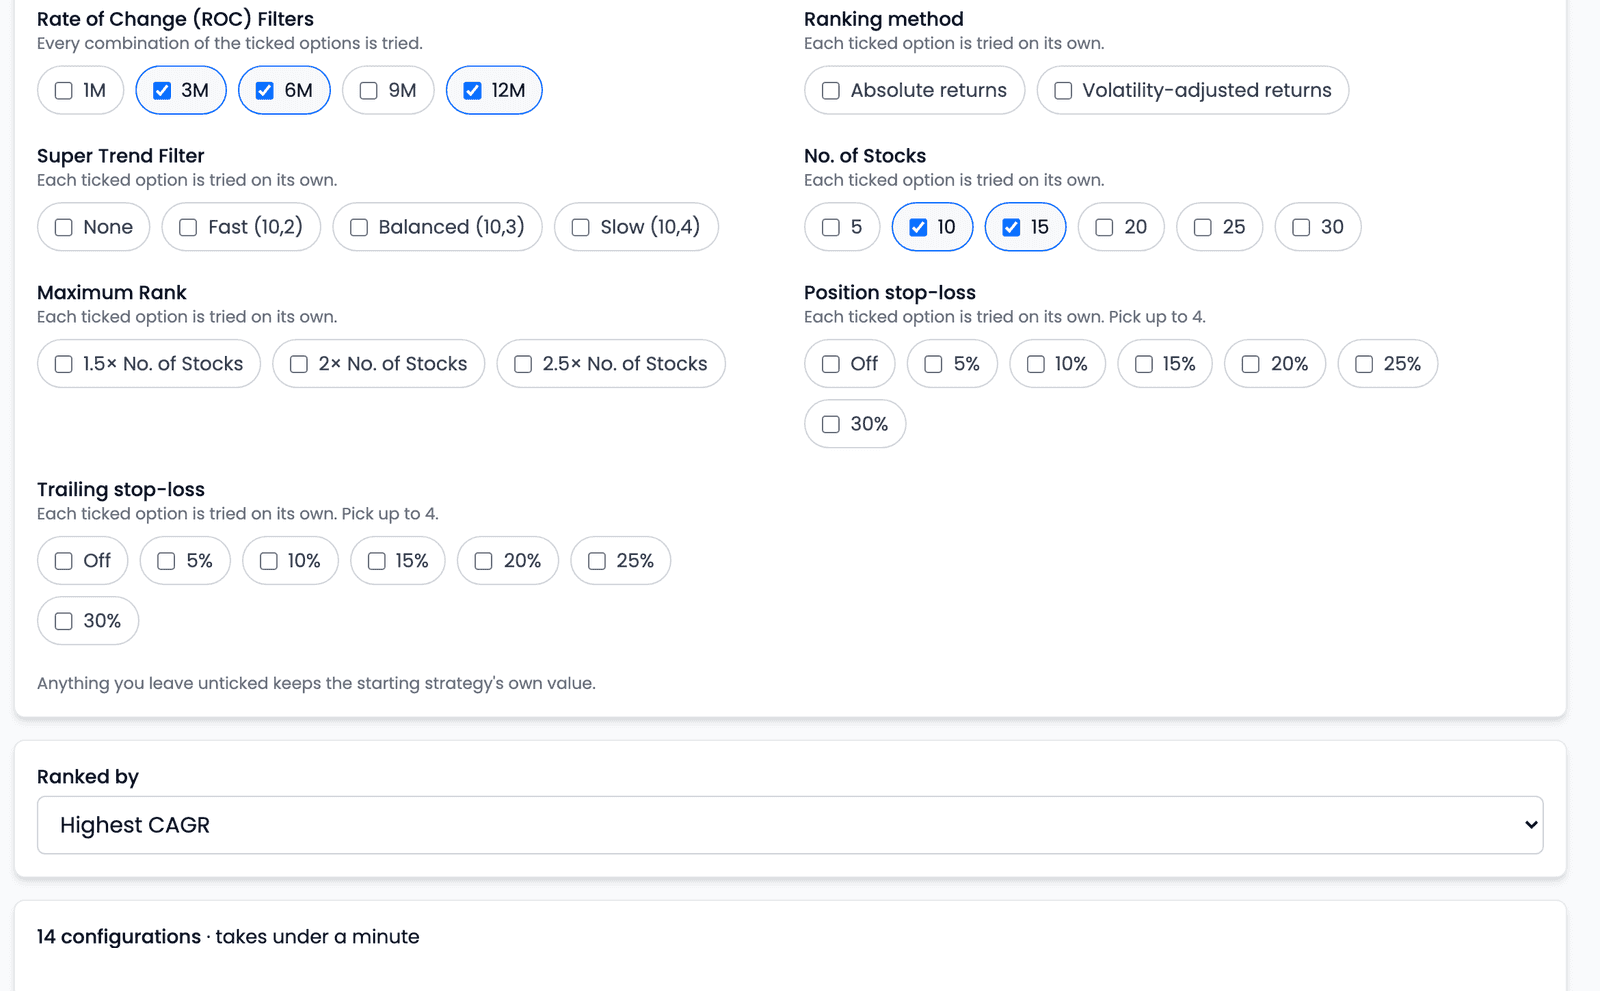
Choose what the list is Ranked by — highest CAGR, best risk-adjusted return, lowest drawdown, or a balance — and check the estimate before you start. It shows how many configurations your ticks produce and roughly how long they will take. The more settings you tick, the more configurations there are to test, so a larger experiment takes longer to finish. An experiment needs at least two configurations, and only one experiment can be queued or running at a time.
While it runs
| Status | What it means |
|---|---|
| Queued | Waiting its turn; experiments run behind the nightly data update |
| Running | Shows how many configurations have been tested so far |
| Completed | Every configuration has a result |
| Cancelled | You stopped it; configurations that had already finished are kept |
| Failed | It could not finish, with the reason shown |
You can delete an experiment from its ⋮ menu in any of these states.
Reading the result
The example is the hypothetical Midcap Climbers strategy — the top fifteen of the Nifty Midcap 150, ranked on 6- and 12-month momentum — with its ROC windows and holding count varied, ranked by highest CAGR over October 2021 to October 2026. It shows how to read the page, not a strategy to follow.
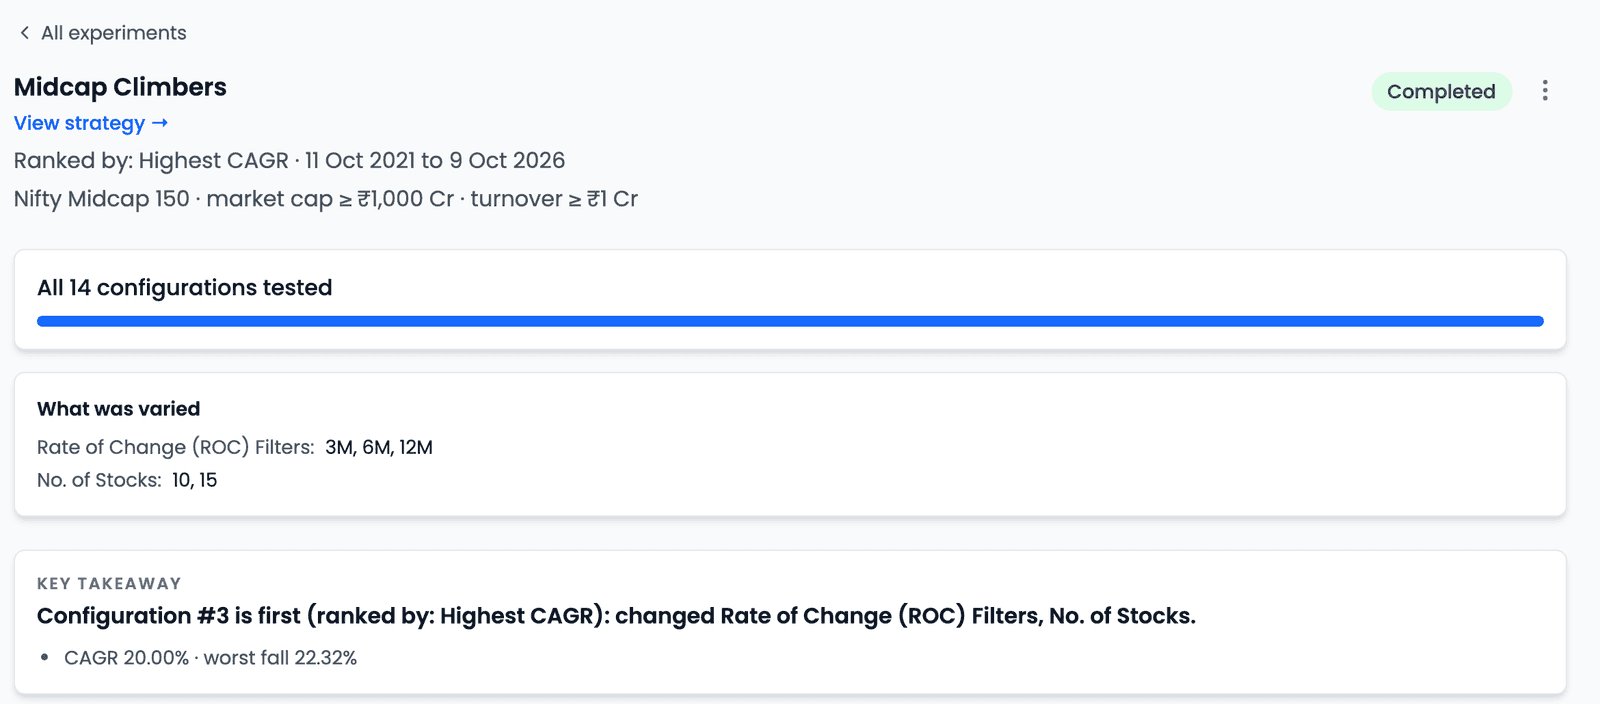
The top of the page restates what was tested — the ranking measure, the dates, the universe and What was varied — and a Key takeaway names the configuration that came first and what it changed. Below, Ranked configurations lists every result, with a Rank by selector to re-sort, Export CSV, and an equity and drawdown chart where each configuration can be plotted or hidden.
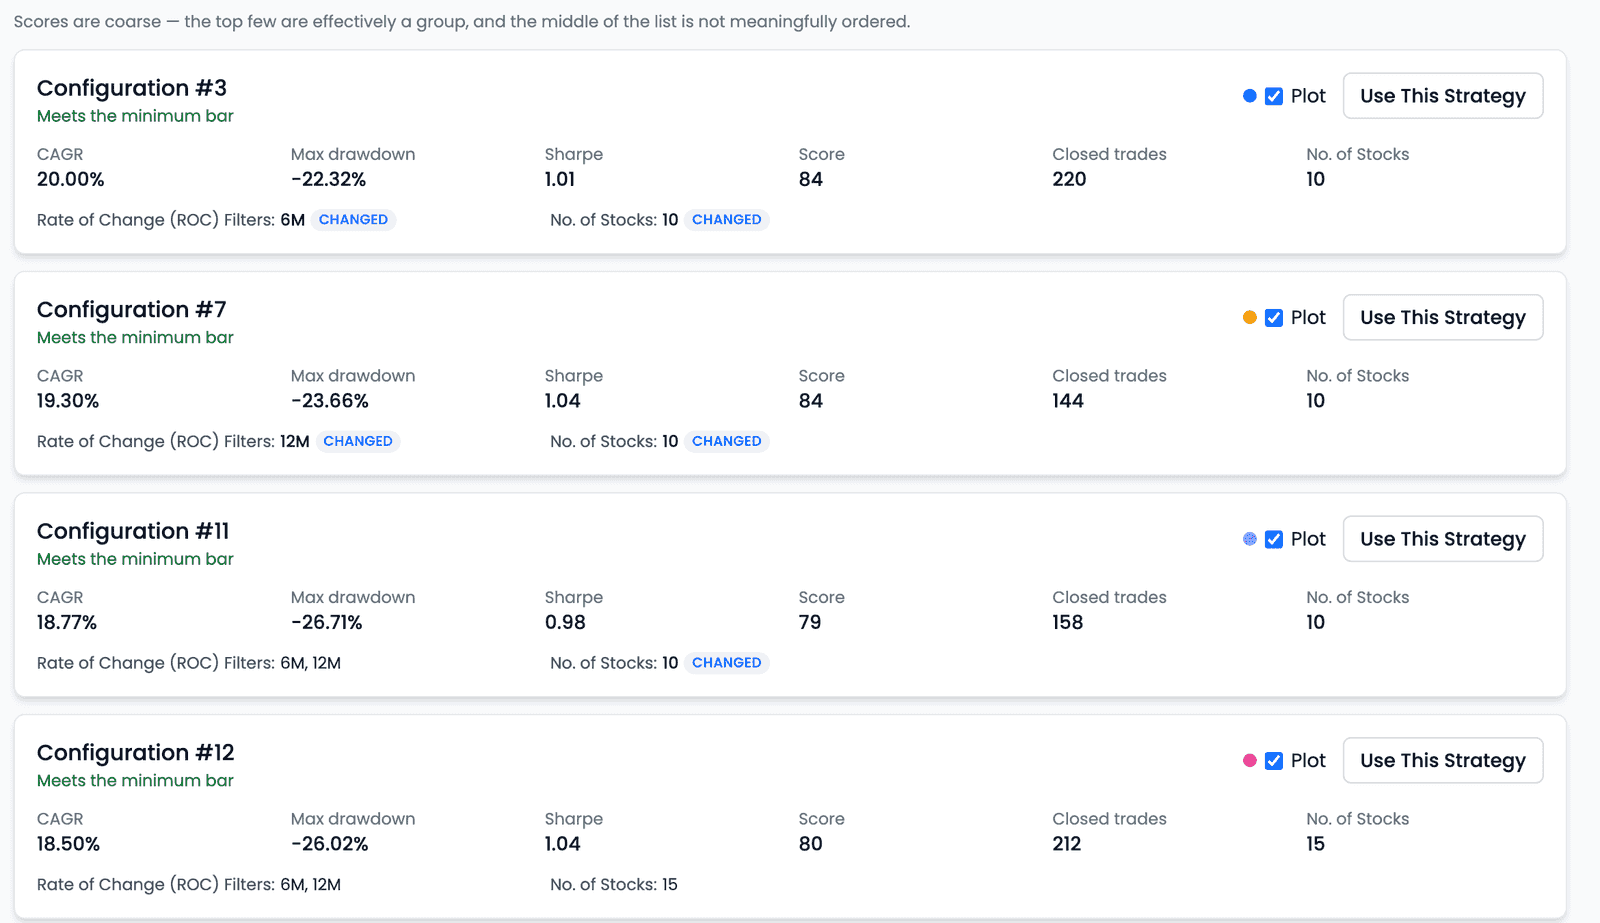
Each card shows its CAGR, maximum drawdown, Sharpe, Score, closed trades and holding count; tags the values that differ from the starting strategy as Changed; and says whether it meets the minimum bar — at least ten closed trades, and a return ahead of the benchmark.
Now read it. Configuration #12 has no Changed tags: it is the starting strategy's own settings, and it ranks fourth.
First place against the starting strategy
Starting strategy (#12)
- 6M + 12M ROC
- 15 stocks
- Worst fall −26.02%
18.50%
CAGR · ranked 4th
Configuration #3
- 6M ROC only
- 10 stocks
- Worst fall −22.32%
20.00%
CAGR · ranked 1st
The tempting reading is that #3 is the better strategy. The useful one is in the pattern: the top three all hold ten stocks, with three different ROC choices between them. That says the holding count moved the result more than the momentum window did — something worth testing. And the page itself warns against over-reading the order: "Scores are coarse — the top few are effectively a group, and the middle of the list is not meaningfully ordered."
First place is a lead to test, not an answer
The ranking chose it for fitting this window
Fourteen configurations ranked on one stretch of history will always produce a first place. Some of its lead is real; some of it is simply the configuration that happened to suit that stretch best — and the ranking cannot tell you which part is which. The more configurations you rank, the more of that luck the first place carries.
So treat first place as a hypothesis. The honest next step is to test it somewhere it was not ranked: run it over a different period, and see whether its edge over its neighbours survives.
Use This Strategy on a configuration's card creates it as a new strategy of your own and runs its backtest. Because that is a Custom backtest, it spends one Strategy credit, and the app asks you to confirm first. From there it is an ordinary strategy: you can Customize its Backtest Period, compare it with the original from Compare Results, or start a simulation from it.
Using it well
Vary one or two settings at a time. A small grid you can read beats a large one that produces a confident-looking first place and nothing else. Before you run, write down what you expect — if you think ten holdings will beat fifteen, say so; the experiment then tests a belief rather than generating one.
Look for agreement among neighbours rather than a single winner. A result that holds across nearby settings is telling you something about the idea; one that stands alone at the top is more likely telling you about the data. None of this predicts future returns, and which strategy you run remains your decision.
Common questions
Which plans include Experiments?
It depends on the plan — the Pricing page lists which ones include Experiments. Without access, the Experiments page tells you so and offers See plans.
Why can only one experiment run at a time?
Experiments are queued and run behind the nightly data update, one per account at a time. Once yours completes, is cancelled or fails, you can start another.
What does "Meets the minimum bar" mean?
That the configuration made at least ten closed trades and returned more than the benchmark over the test period. It is a floor for taking a result seriously, not a recommendation.
Is the first configuration the best strategy?
No. It came first on one measure over one period. Treat it as a lead to test on a period it was not ranked on, and look at whether the configurations near it agree.
Key takeaways
- An Experiment backtests many variations of one starting strategy in a single run and ranks them by the measure you choose.
- Unticked settings keep the starting strategy's value; ticked ones combine — ROC and moving averages in every combination, the rest one option at a time — and the counts multiply.
- Check the estimate before running: how many configurations, and roughly how long. Larger experiments take longer. Only one experiment runs at a time.
- Read the pattern across the top of the list, not just first place — here, ten holdings led regardless of the ROC window.
- The page's own note applies: scores are coarse, the top few are effectively a group.
- First place is a lead chosen for fitting one window; test it on a period it was not ranked on.
- Use This Strategy creates the configuration as a new strategy and runs its backtest, spending one Strategy credit.