
Running & Understanding Backtests
A backtest replays your rules against history, one rebalance at a time. This is how it decides when to trade, how the results page is laid out, and why a single CAGR can describe two years that felt nothing alike.
What You’ll Learn
By the end of this article, you’ll understand:
- What a backtest replays, and what it leaves out
- Why signals come from one day's close and trades from the next
- How the results page is organised, and which tab answers what
- Why one CAGR can describe two very different years
- How Backtest History keeps every run of a strategy, and what Save As and Customize cost
- The four things a backtest cannot tell you
What a backtest actually is
A backtest takes the strategy you specified and replays it against historical data, one rebalance at a time. On each scheduled date it re-runs the whole pipeline — universe, eligibility, ranking, selection — and does whatever the rules say, using only the data available on that date. NiveshBuddy's history runs from 2021, on end-of-day prices adjusted for corporate actions; how far back your own backtests can reach depends on your plan.
The important word is replays. Nothing is optimised as it goes and nothing is decided in the moment. If the rules said hold fifteen stocks on a day the market fell four percent, the backtest held fifteen stocks.
That makes it a test of the rules, not of you. It shows what the specification would have done, which is a different and more useful question than what you would have done while watching it happen.
A backtest is not instant. When you press Run Backtest, the result shows as pending and then running while it computes, and the page fills in when it completes. A Quick Strategy runs without spending anything; a backtest from the Custom Strategy Builder spends one Strategy credit, and the app asks before it does.
When it decides to trade
This is the part most worth understanding, because it is where a backtest can quietly lie to you if it is built carelessly.
One rebalance, on a strategy that rebalances on Mondays
- Friday's closeThe rules are evaluated against that day's end-of-day data
- Signals generatedWhich holdings leave, which candidates enter
- Monday's closeThose trades execute at Monday's official closing price
The gap between the two is deliberate. If a backtest could act on the same close it read the signal from, it would be using information the rules could not have had in time — a flaw called look-ahead bias, and one that flatters results without ever looking wrong on screen.
So trades in a NiveshBuddy backtest do not execute the instant a signal appears, and they do not execute intraday. They execute at the scheduled rebalance close. The same rule holds whatever the rebalance day is: a strategy that rebalances on the 1st of the month reads the previous trading day's close and trades at the 1st's.
Six figures and a takeaway
The example throughout is Midcap Climbers, a hypothetical Custom strategy — the top fifteen stocks of the Nifty Midcap 150 ranked on 6- and 12-month momentum, rebalanced monthly — tested from October 2021 to October 2026. It is an illustration of how to read the page, not a strategy to copy.
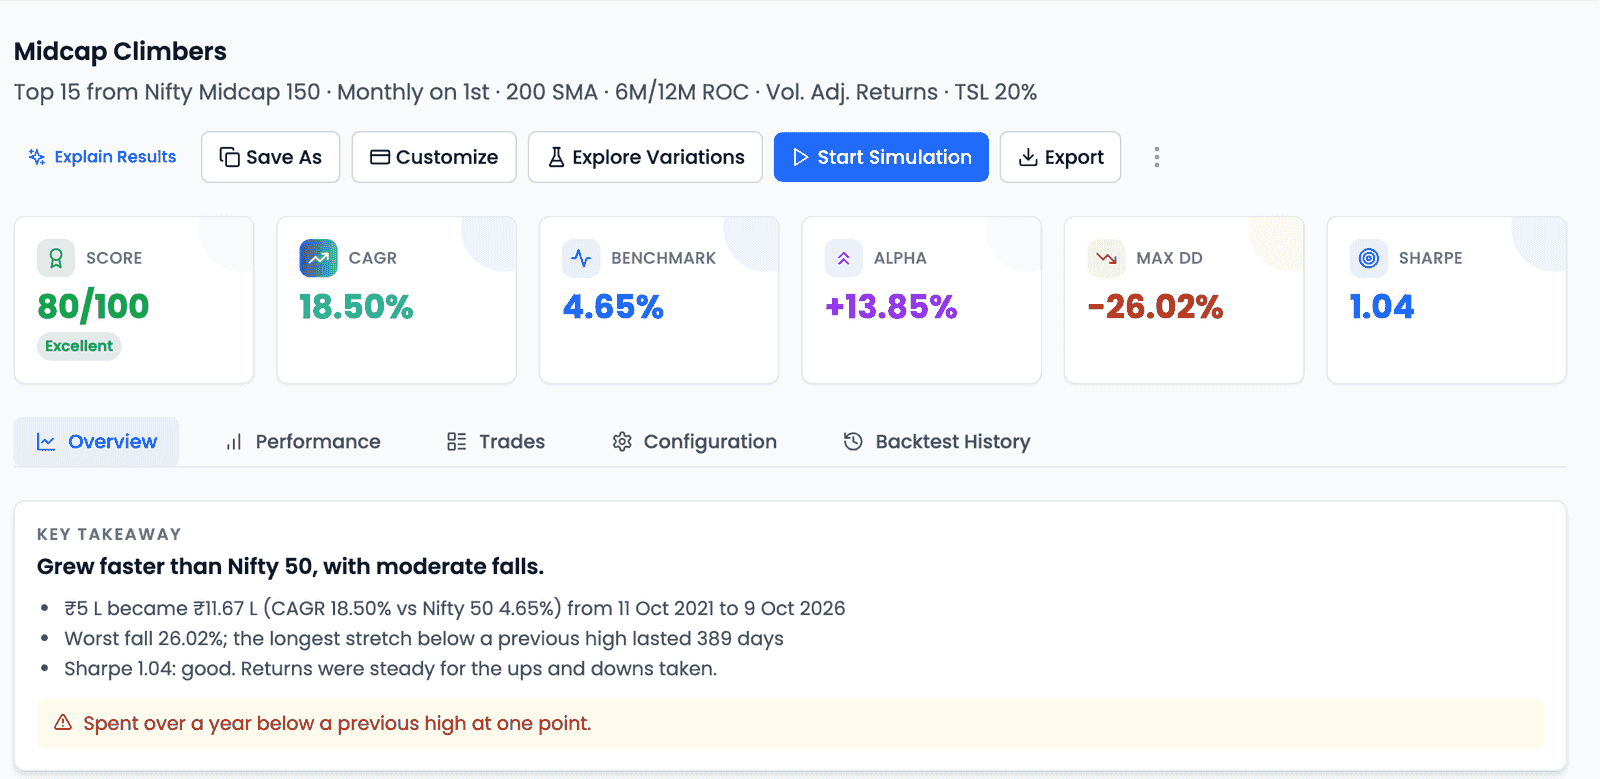
Two things on the cards are easy to over-read.
The Score and its band are the product's own summary. This result shows
80/100 with the badge Excellent — that is the page's word for it, not a verdict
you should adopt or repeat. The Score combines return quality, risk control,
risk-adjusted return and consistency into one number, which makes it a reasonable
place to start a review and a poor place to end one.
The benchmark sits right beside the strategy. CAGR 18.50% next to
Benchmark 4.65% — the Nifty 50 over the same window — means "compared to what?"
is built into the first thing you see. Alpha is the gap between them.
Below the tabs, the Key takeaway writes the same result out in plain words: a one-line headline, what ₹5 lakh became (₹11.67 lakh here, against the Nifty 50's far smaller gain over the same dates), the worst fall and how long the longest stretch below a previous high lasted, and the Sharpe ratio in words. When something deserves a warning it adds one — here, "Spent over a year below a previous high at one point." It is generated from this one backtest and describes one window; none of it is advice about whether a strategy suits you.
The buttons above the cards are the strategy's next steps:
| Button | What it does |
|---|---|
| Explain Results | Replays a short guided tour of this page |
| Save As | Copies the strategy under a new name. Free |
| Customize | Reopens it in the Custom Strategy Builder with every setting editable; the re-run spends one Strategy credit |
| Explore Variations | Starts an Experiment from this strategy, on plans that include Experiments |
| Start Simulation | Begins a forward-looking Simulation — a deliberate step; a backtest never becomes one on its own |
| Export | Downloads an HTML report of the result |
Delete sits in the ⋮ menu. On a phone, everything except Start Simulation moves into that menu.
Five tabs, five questions
| Tab | The question it answers |
|---|---|
| Overview | What did the journey look like? |
| Performance | How good was it, and how evenly? |
| Trades | What actually happened, trade by trade? |
| Configuration | What exactly was tested? |
| Backtest History | How does this run compare with earlier runs of the same strategy? |
This article is about reading the screen. What CAGR, Sharpe, Sortino, win ratio and profit factor each mean — and how they mislead when read alone — is covered in Understanding Investment Performance & Risk Metrics, which is worth reading alongside this one.
Overview: the shape of the journey
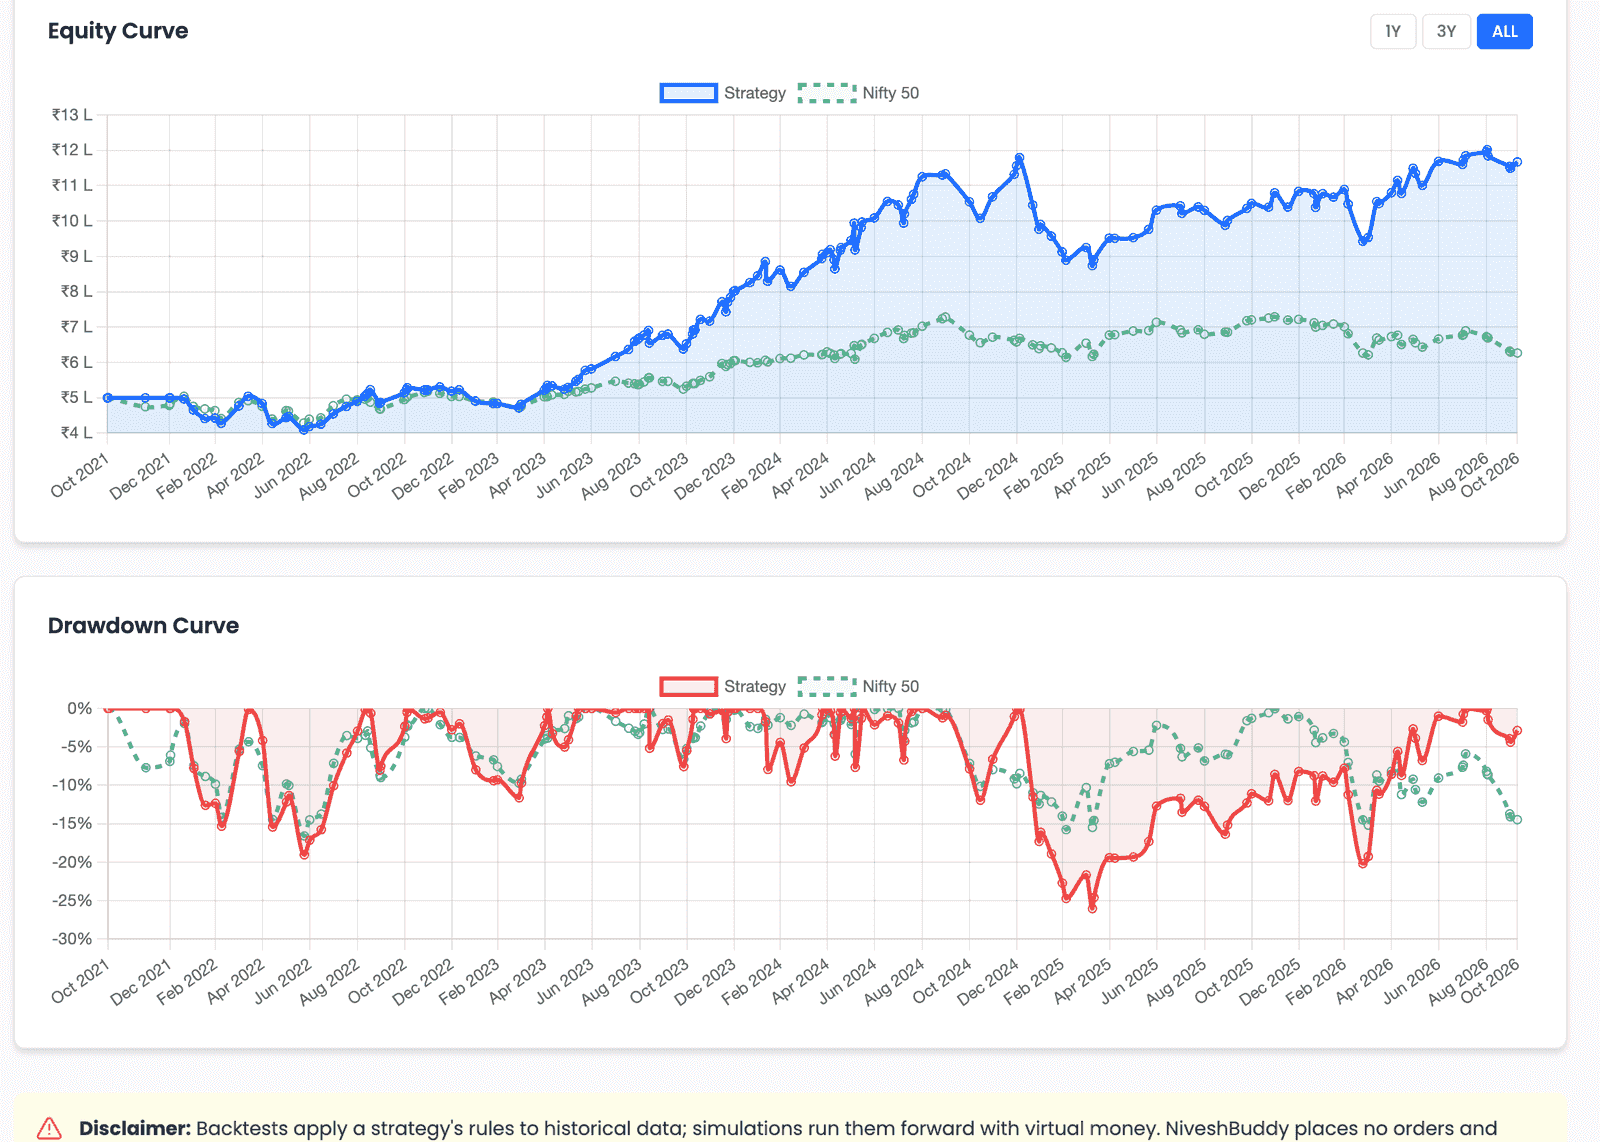
The Equity Curve plots the strategy against the Nifty 50. Range buttons sit
above it, and which ones appear depends on how long the test ran — this five-year
backtest offers 1Y, 3Y and ALL; a two-year one would have no 3Y.
The Drawdown Curve below it is the same result told differently: every point is how far below its previous peak the strategy was at that moment. A rising equity curve and an uncomfortable drawdown curve are not a contradiction. They are the same five years, and the second is the one that describes what holding it would have felt like.
Performance: where the average comes apart
The Performance Snapshot groups its metrics under four headings — Growth, Risk & Drawdowns, Quality of Returns and Portfolio Behavior — each with a plain-language subtitle. Note that Sharpe and Sortino sit under Quality of Returns rather than with the risk figures.
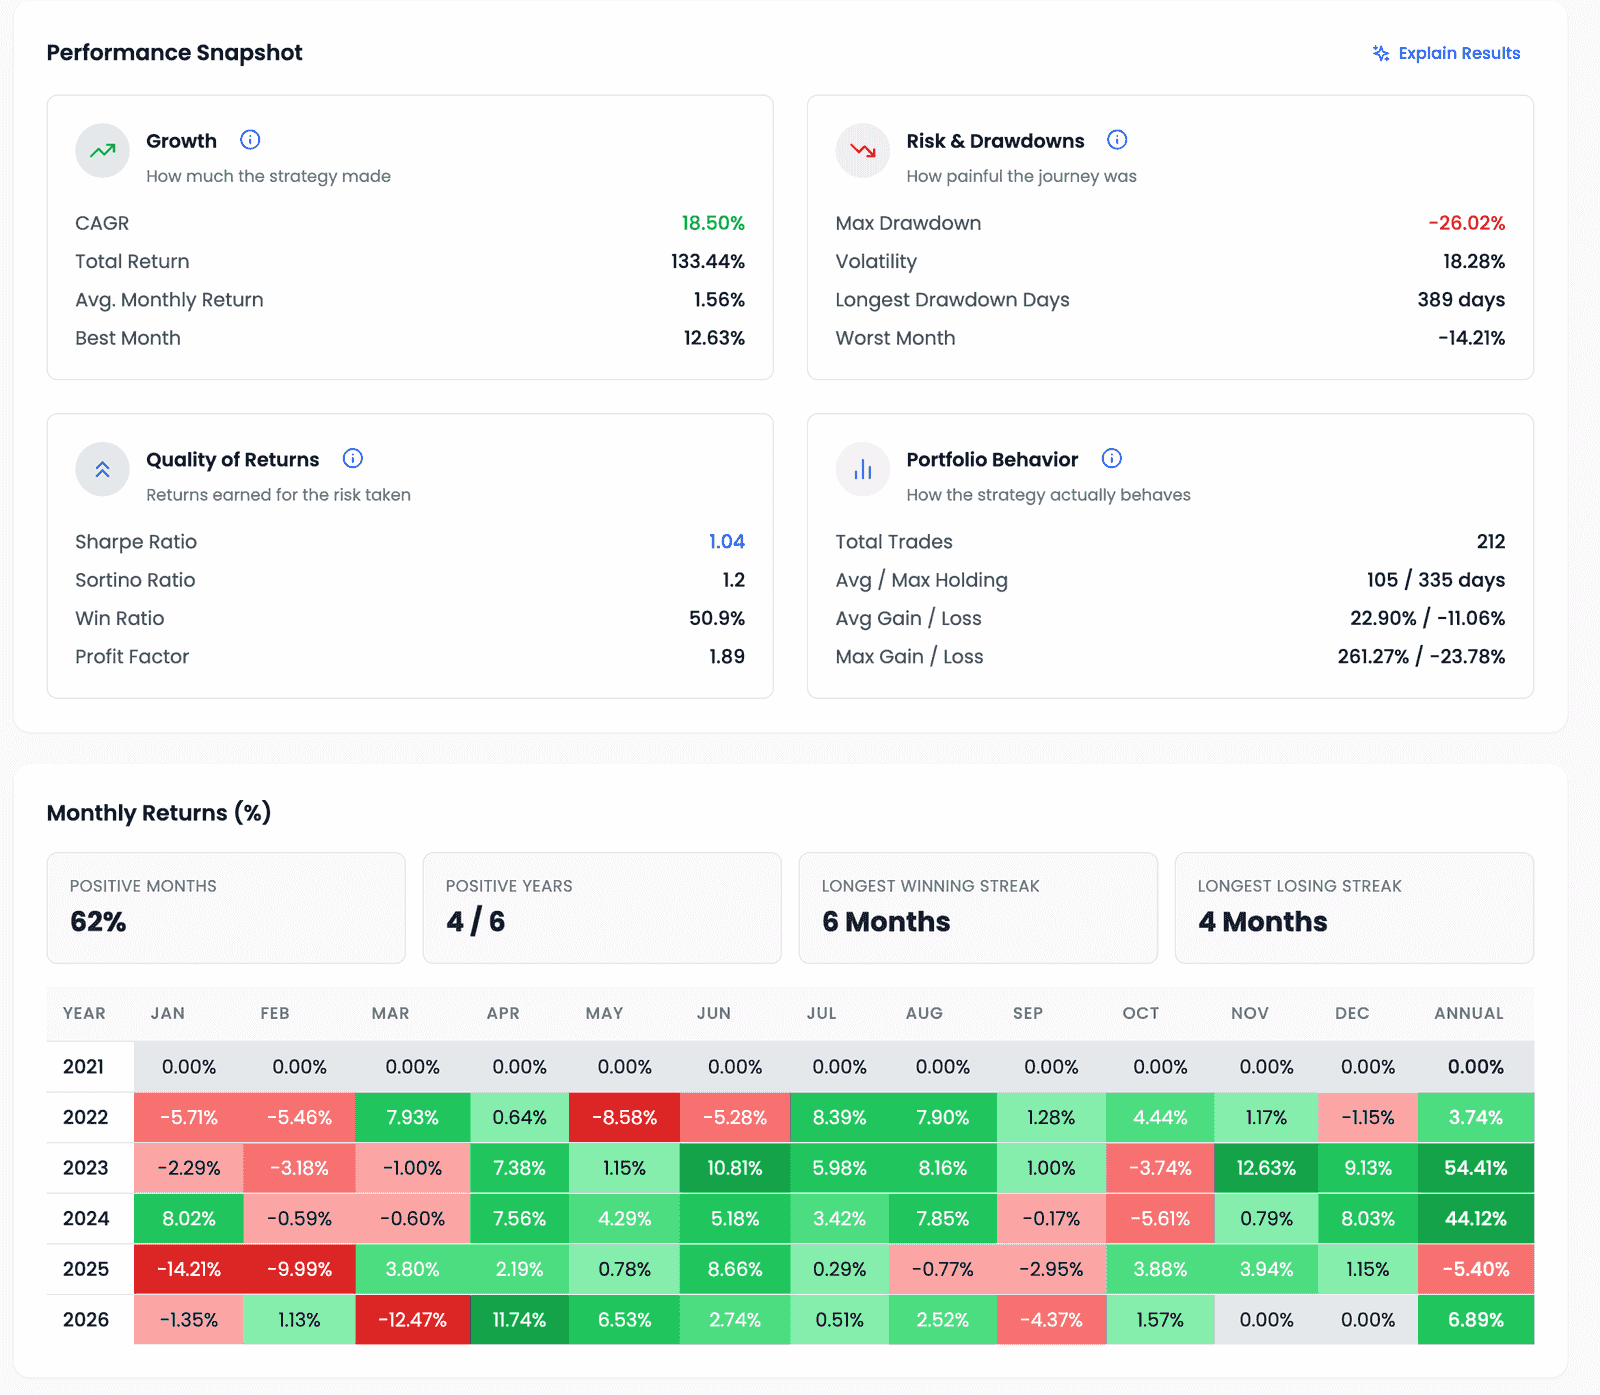
Below it, Monthly Returns is the most revealing thing on the page. Four tiles summarise consistency — here, 62% of months positive and four of six calendar years — and a heatmap puts every month of every year in a grid with an Annual column on the end.
That grid is where a headline figure comes apart.
The same strategy, two years apart
2023
- The rules, unchanged
- Eight positive months of twelve
- A best month of +12.63%
+54.41%
annual return
2025
- The same rules, still unchanged
- Eight positive months again
- January alone gave back 14.21%
−5.40%
annual return
Nothing changed between them. Same universe, same filters, same ranking, same fifteen holdings. One year did a large share of the work and another lost money, with the same number of positive months in each — and a single annualised number stands in for both.
This is the honest way to read any headline return: not as what the strategy delivers, but as an average of years that may have looked nothing like each other.
Trades: what actually happened
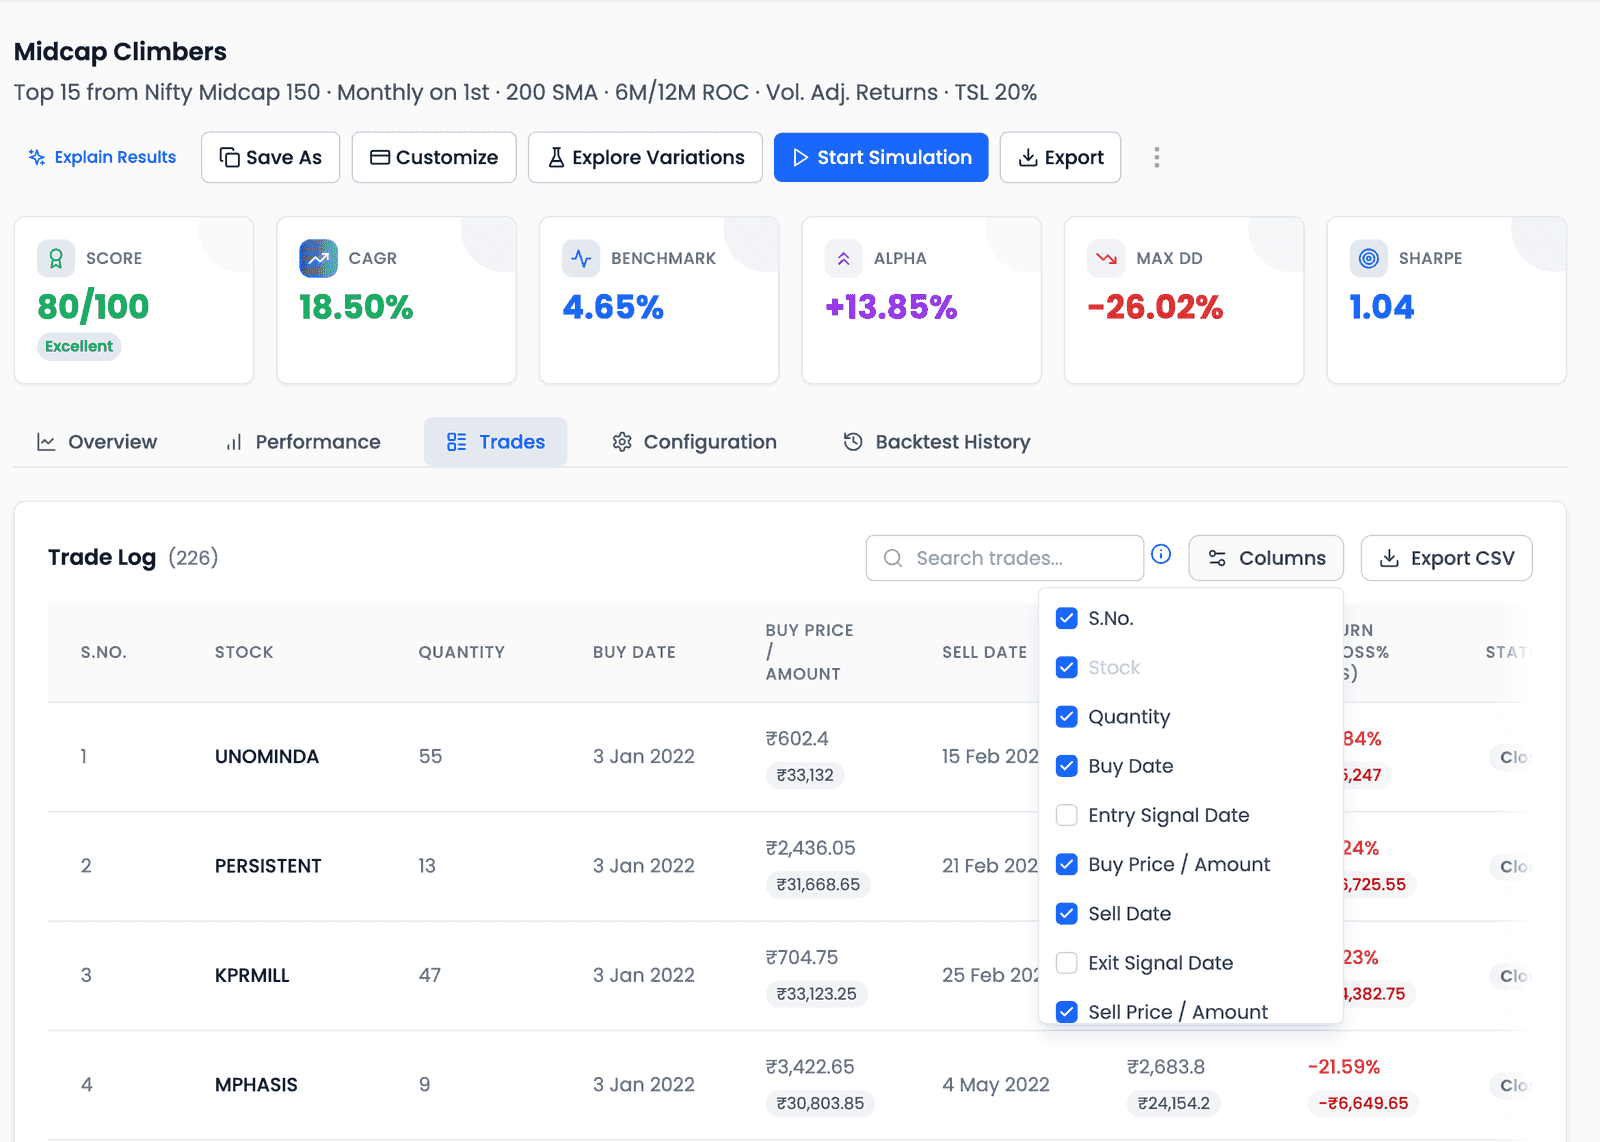
The Trade Log lists every trade with its dates, prices, return and status. It has a search box and Export CSV, and a Columns menu that switches on columns hidden by default — among them Entry Reason and Exit Reason, which say why each trade happened (a rank drop, a stop being hit), Holding Period, and two that matter for costs: Return (Net% /Abs) and Transaction Cost.
The log is also where the cost assumption becomes concrete. This backtest made 212 trades, and it assumed a transaction cost of 0.1% — charged on every buy and every sell. Many backtests assume zero, because that is the default. Turning on the net-return column shows what costs took, trade by trade, and re-running with a cost you would actually pay is one of the cheapest sanity checks available.
Configuration: what was actually tested
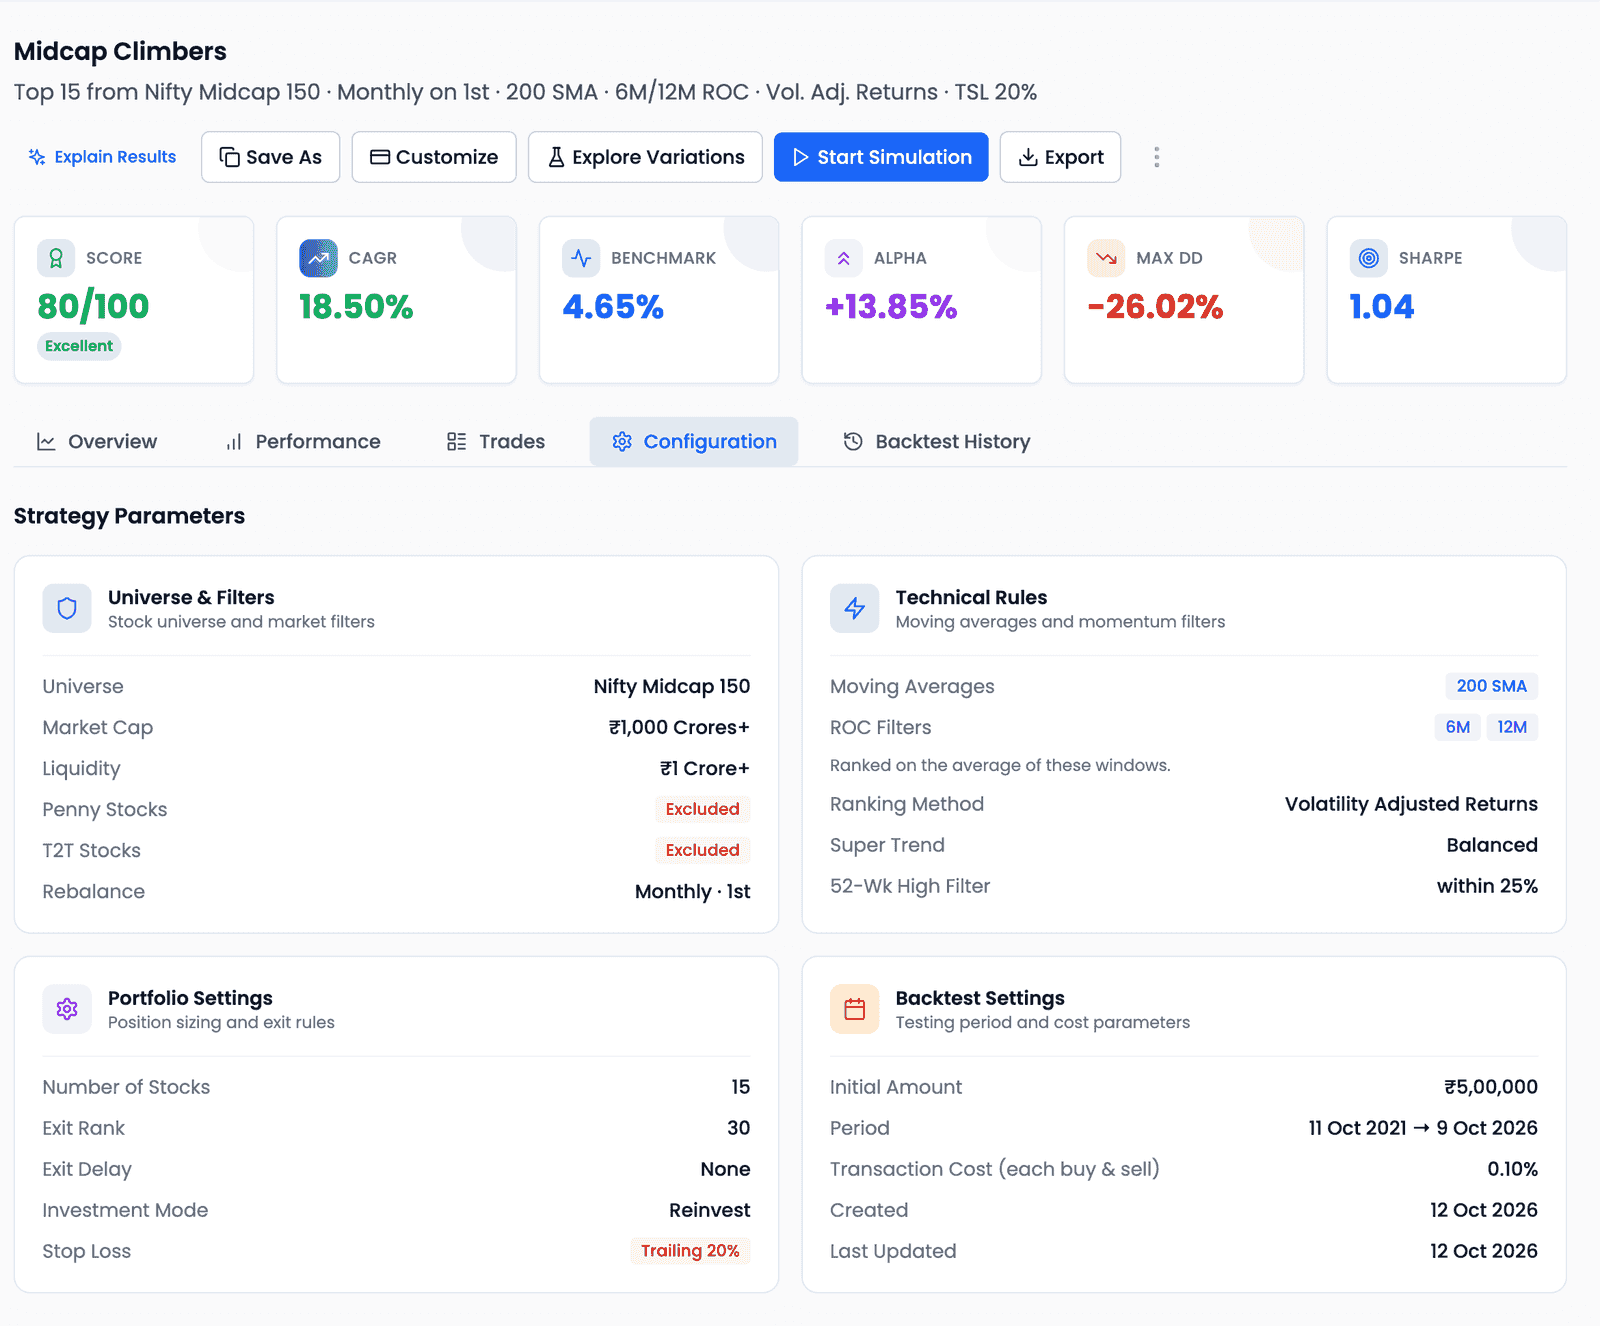
The Configuration tab echoes the strategy's settings back in four cards, the same groups as the builder's steps. It repays a careful read, because it states what was actually tested rather than what you meant to test — the period, the starting amount and, especially, Transaction Cost (each buy & sell). That is not a NiveshBuddy fee; it is a figure you set in the builder, and it defaults to zero.
Backtest History: every run of the strategy
Each time a strategy is backtested again — after a Customize, say — the new run becomes the strategy's Current result, and the earlier one is kept.
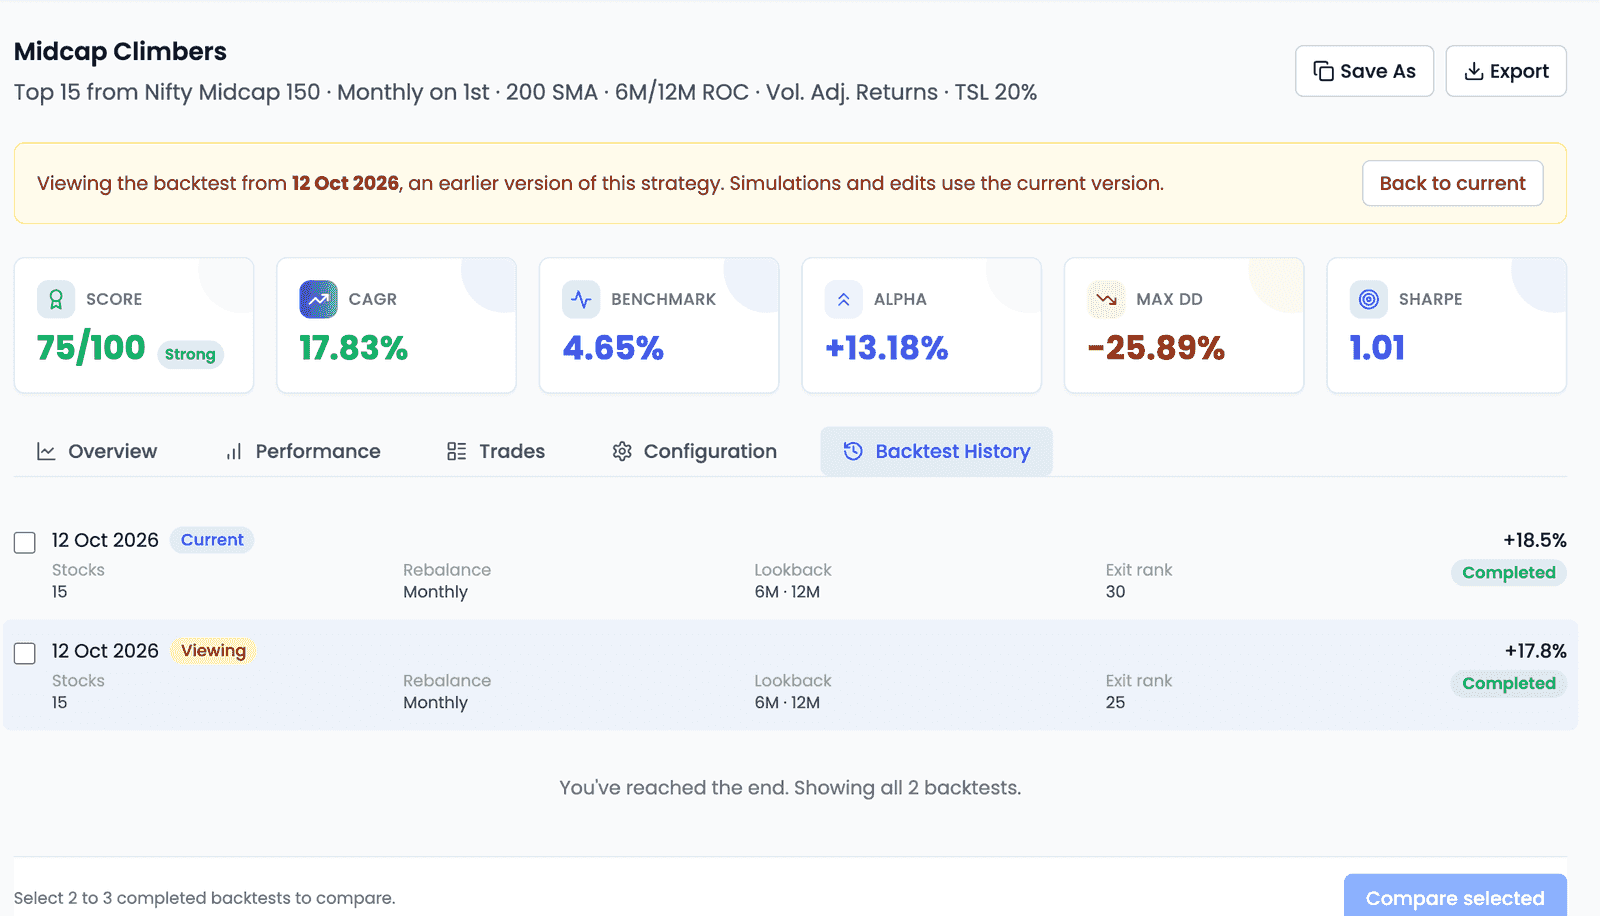
Here, the only change between the two runs was Exit Rank, from 25 to 30. Opening the older run shows its figures in place, marked Viewing, under a banner that makes one rule plain: simulations and edits use the current version. While you view an older run, only Save As and Export are offered; Back to current returns you.
Tick two or three completed runs and press Compare selected to see them side by side on the Compare Results page — the most direct way to see what a single change actually did.
What a backtest cannot tell you
Four honest boundaries
It is not a prediction
A backtest says what the rules would have done in conditions that have already happened. It says nothing about whether those conditions return, and historical results do not guarantee future performance.
It counts only the cost you entered
Transaction Cost is yours to set — charged on each buy and each sell — and it defaults to zero. It is the only cost the model takes. Slippage, market impact, taxes and how your broker actually fills an order are not modelled. The gap between a backtest and a real account lives largely here.
It ran on one date range
Change the period and the answer changes. With history from 2021, a window can easily be dominated by one kind of market, which is why one result is evidence and not proof.
A good result can be an accident
The more rules you stack, the easier it is to find a combination that happens to fit the past. A strategy you can explain in a sentence is easier to trust than one that merely scored well.
Backtests help evaluate a rules-based approach on the evidence available. Historical results do not guarantee future performance, and what you do with a strategy remains your decision.
Key takeaways
- A backtest replays your specification against history one rebalance at a time, using only the data available on each date — history from 2021, bounded by your plan.
- It tests the rules, not your ability to follow them, which is what makes it useful and what limits it.
- Signals come from the prior trading day's close and trades execute at the rebalance day's close — Friday to Monday for a Monday rebalance.
- That gap exists to prevent look-ahead bias; trades never execute intraday or the moment a signal appears.
- The Score and its band are the product's summary of one result, a place to start a review rather than end one.
- The Benchmark card is the Nifty 50 over the same window, so the comparison is part of reading the screen rather than a later step.
- The Key takeaway is generated from this one backtest and describes what happened; it is not advice about what suits you.
- Overview shows the shape, Performance the quality and evenness, Trades what happened, Configuration what was tested, and Backtest History how runs compare.
- The Monthly Returns heatmap is where a headline figure comes apart: 2023 returned 54.41% and 2025 lost 5.40%, and one CAGR stands for both.
- Transaction Cost is yours to set, charged on each buy and each sell, and defaults to zero — the Trade Log's net-return column shows what it took.
- Save As is free; Customize re-runs the strategy as a Custom backtest and spends one Strategy credit. Earlier runs stay in Backtest History.