
Reading Simulation Results
A simulation's page is the running record of a virtual portfolio: what it's worth, what it holds, every trade and every rupee in and out. What each card and tab shows, which figures sound alike but aren't, and why a simulation carries no Score.
What You’ll Learn
By the end of this article, you’ll understand:
- What each of the six cards at the top tells you
- The difference between Portfolio Value, Current Value, Invested Value and Starting Capital
- What the Key takeaway says, and why it waits 30 days
- What each tab is for, from Active Portfolio to Configuration
- Why a simulation has no Score, and how to judge it instead
Overview
A backtest ends with a verdict: one run over history, summed up in a Score. A simulation never ends that way. Its page is a record of a virtual portfolio that is still running: what it is worth today, what it holds, what it traded and why, and every movement of its cash.
This guide walks through that page using a hypothetical demo, Broad Market Daily Momentum Simulation, three trading days after it started. It is a deliberately early example. Its figures are small, mostly red and say almost nothing about the strategy, which is itself one of the most useful things to learn about reading a simulation.
The six cards
The header names the simulation, its status and three dates: when it Started, when it was last Updated (after the latest market update), and its Next Rebalance. Beside them are Explain Results, Logs, Pause, Stop and Export. Below sit six cards.
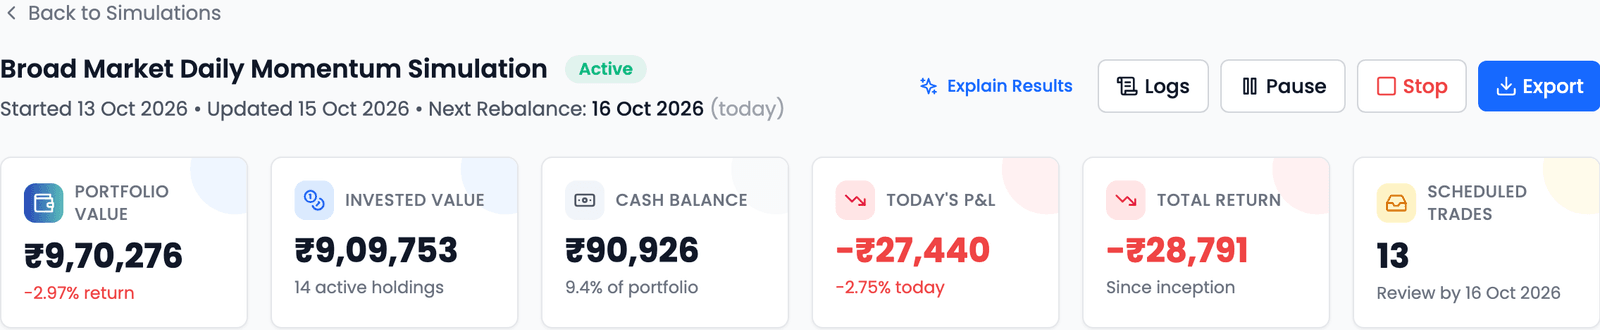
| Card | What it shows |
|---|---|
| Portfolio Value | What the whole virtual portfolio is worth now (holdings plus cash), with its % return underneath, after transaction costs |
| Invested Value | What the current holdings cost, with the number of active holdings |
| Cash Balance | Cash not invested, and its share of the portfolio |
| Today's P&L | How much the portfolio moved on the latest trading day, in rupees and % |
| Total Return | The gain or loss in rupees since the simulation started, before transaction costs |
| Scheduled Trades | How many trades are waiting to run at the next rebalance, and the date to review them by; Nothing scheduled when there are none |
The two returns differ on purpose. The % under Portfolio Value is the net return: it includes what every buy and sell cost. Total Return leaves those costs out. So Total Return is the slightly better-looking figure, and the gap between them is what trading has cost so far. In the demo, −₹28,791 before costs is about −2.88%, against −2.97% after them; on a simulation that trades daily, that gap grows faster.
There is no Realised P&L or Total P&L card. Gains and losses on trades that have closed are in the Trade Log, one row each.
Four values that sound alike
Four figures on this page are all "how much", and they answer different questions.
Starting Capital
The virtual money the simulation began with, ₹10,00,000 here. It is fixed for the simulation's life and never changes.
Invested Value
What the holdings you have now cost to buy. It moves only when something is bought or sold, not when prices move.
Current Value
What one holding is worth at its current price. It is a column on Active Portfolio, one figure per stock.
Portfolio Value
The whole portfolio at today's prices: every holding's Current Value added up, plus the cash. This is the figure the return is measured on.
So when Invested Value is above the holdings' combined Current Value, as it is here, the holdings are worth less than they cost. Portfolio Value against Starting Capital is the simulation's result so far.
The Key takeaway
At the top of the Overview tab, the Key takeaway puts the result into one line. For the first 30 days, it doesn't try:

After 30 days, it reads like "Up x% since {start}" (or Down), and adds a caveat when more than half of the portfolio is in cash, because a mostly-cash portfolio's return says little about its strategy.
The tabs
Overview
Overview is the summary: the Key takeaway, any Scheduled Trades waiting to run, the Equity Curve and Drawdown Curve against the Nifty 50, and three panels at the bottom.
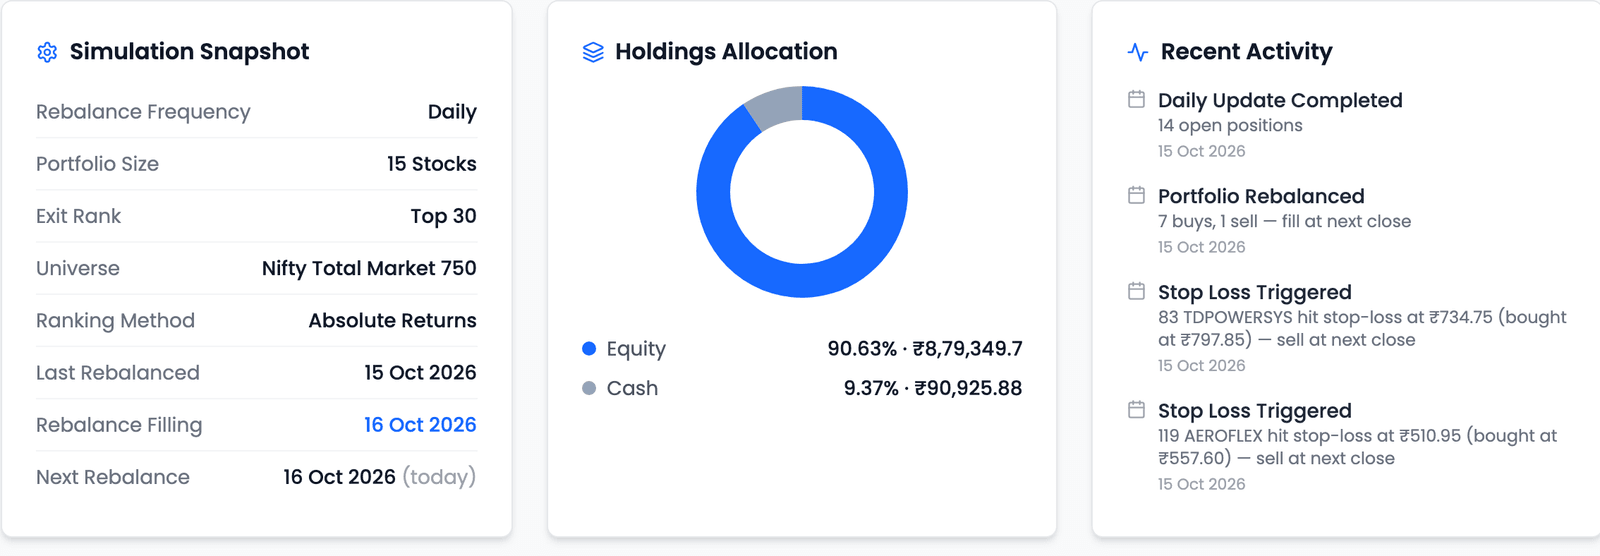
Simulation Snapshot repeats the rules it is running, and the dates of its last and next rebalance. Rebalance Filling appears while a rebalance's trades are waiting for the close they run at. Holdings Allocation splits the portfolio into equity and cash. Recent Activity lists the latest events in plain words: a rebalance and how many trades it scheduled, a stop loss triggered, a daily update completed.
Active Portfolio
Current Holdings lists what the portfolio holds now, with how many positions it has against its target, here 14 of 15.
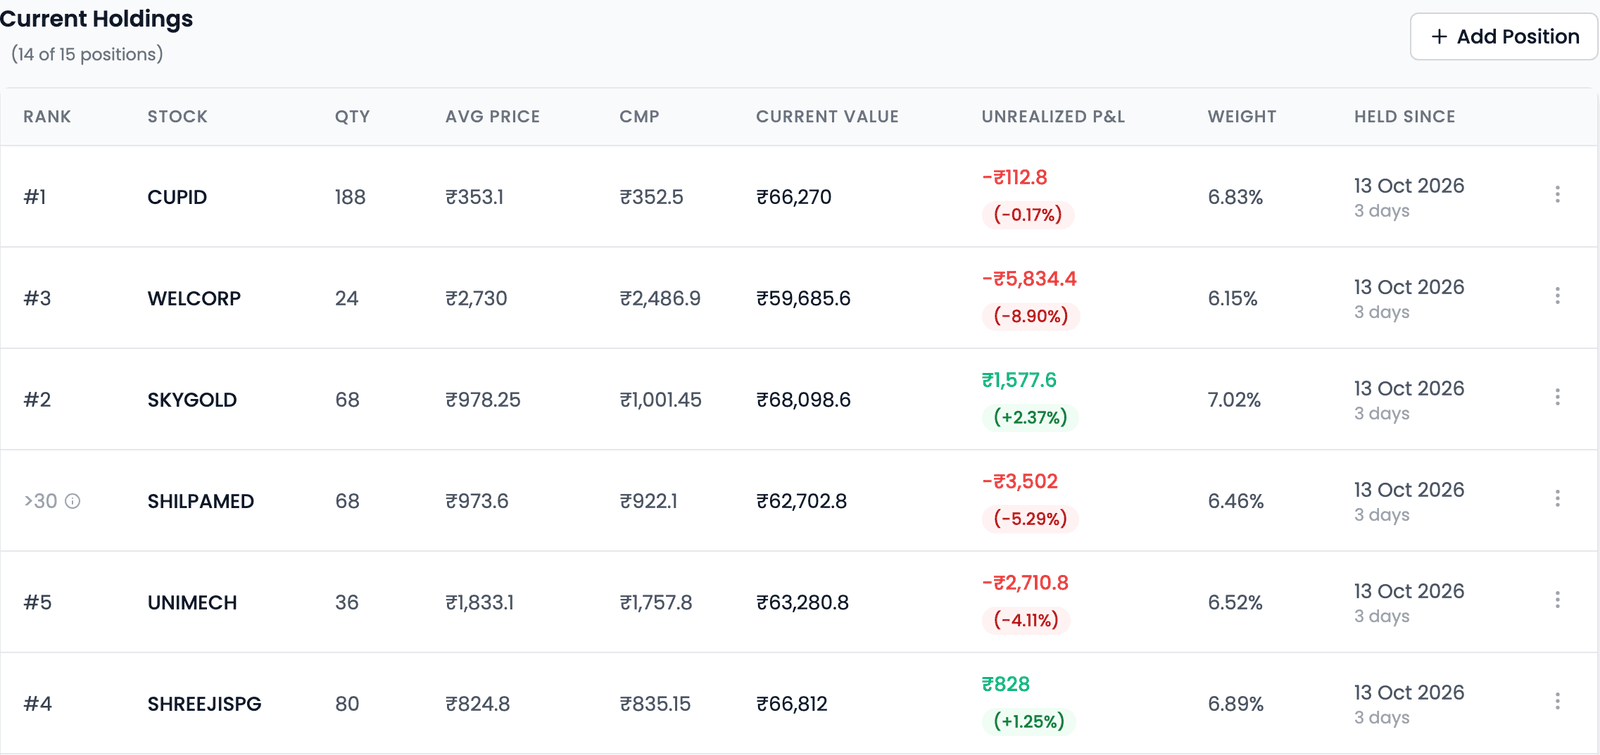
| Column | What it tells you |
|---|---|
| Rank | Where the stock ranks today under the strategy's rules. >30 means it has fallen past the Exit Rank; Unranked means it no longer passes the filters at all |
| Qty · Avg Price | How many shares the simulation holds, and the average price it paid |
| CMP · Current Value | The current market price, and the holding's worth at that price |
| Unrealized P&L | The gain or loss on the holding if it were sold at the CMP |
| Weight | Its share of the portfolio |
| Held Since | When it was bought, and for how long it has been held |
A Manual pill marks a position you added yourself, and a Restated pill one adjusted for a split or bonus. A holding with neither came from the strategy. The menu at the end of each row, and the Add Position button, record what you actually did at a broker; that has its own guide.
Performance
Performance shows the same Performance Snapshot as a backtest: growth, risk and drawdowns, quality of returns and portfolio behaviour, then monthly returns.
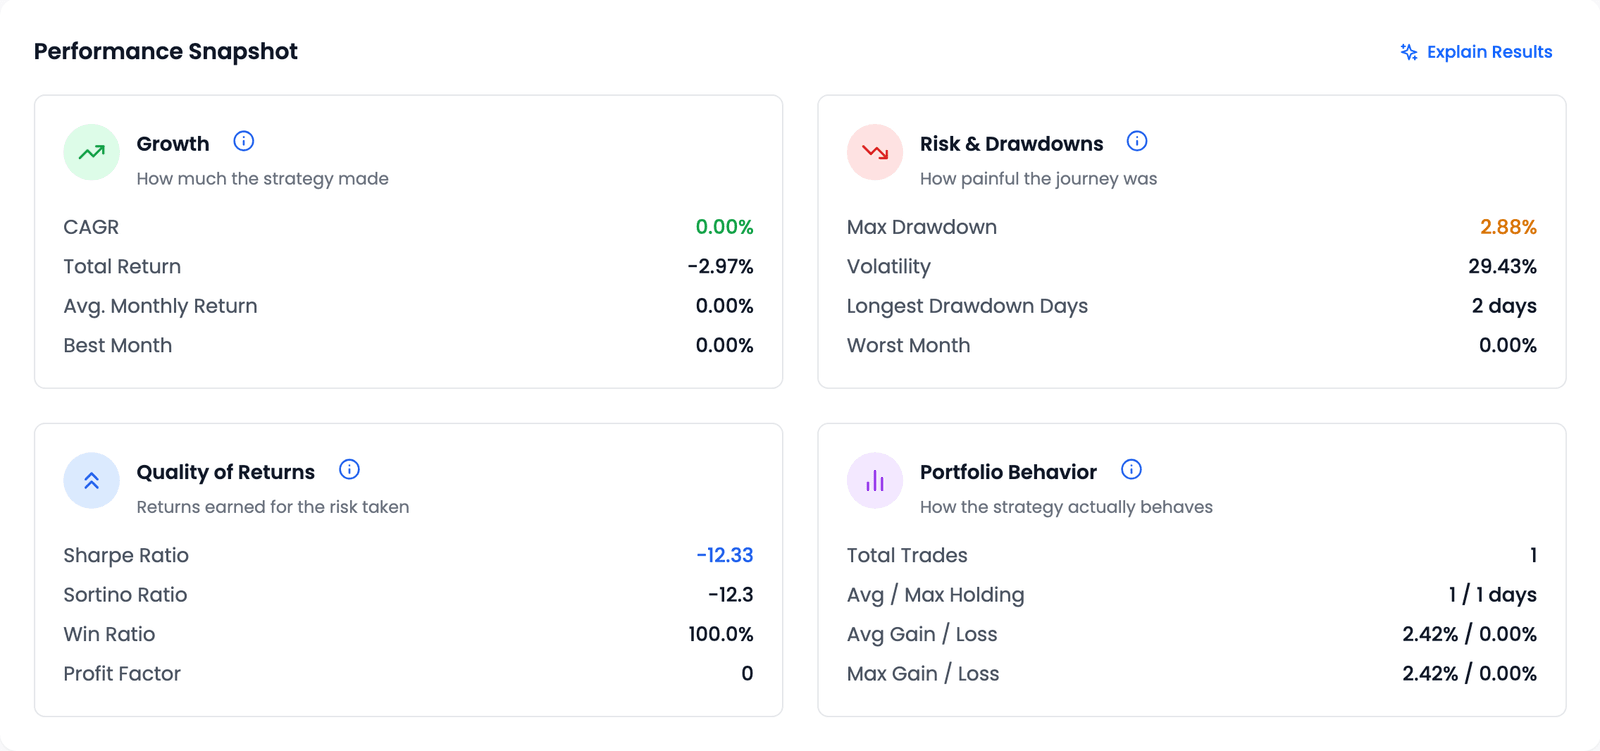
These are the same measures as in a backtest, and they need time even more. CAGR isn't calculated until the simulation has run for 90 days, because annualising less than that turns noise into extreme figures; until then it shows as 0.00%. Ratios like Sharpe and Sortino are annualised, so three days of falling prices turn into an extreme figure: −12.33 here. A Win Ratio of 100% comes from a single closed trade. Treat this tab as meaningless for the first weeks, and only start comparing it with the backtest's figures after several rebalances.
Trade Log
The Trade Log has one row per round trip: a buy, and the sell that closed it if there was one. The table scrolls sideways; its right-hand columns are the ones that explain each row.
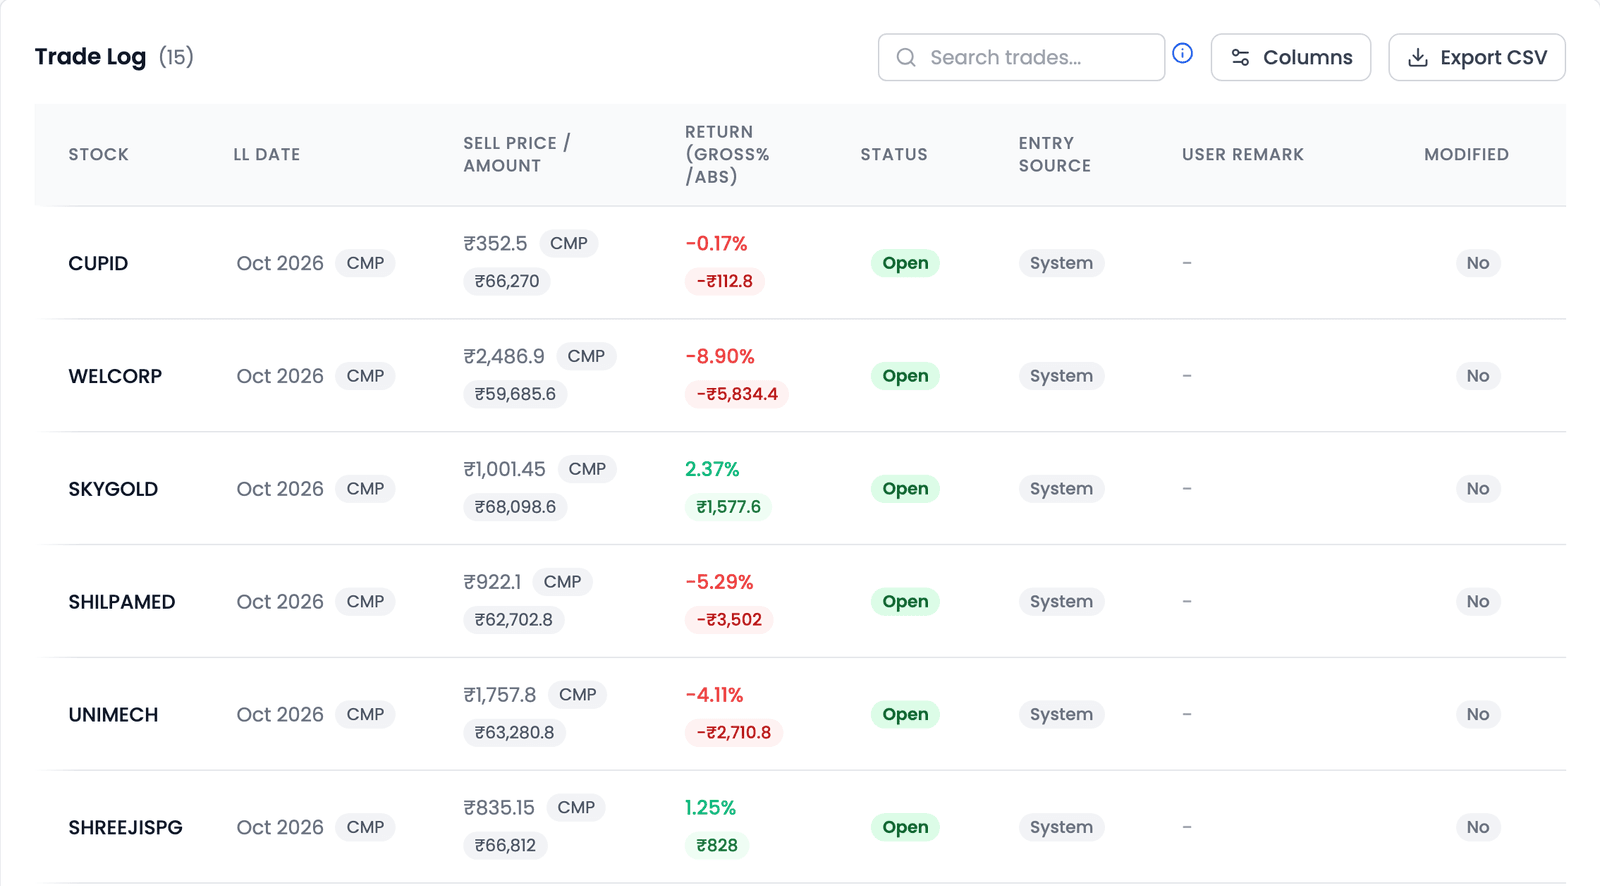
- Status is Open for a holding still held, Closed once it has been sold, or Skipped for a trade that never ran. An open row's sell price is the current price, marked CMP, so its return is a running figure, not a final one.
- Entry Source says how the position was entered: Auto, System, Manual or Execution Adjusted. Positions the simulation bought itself read System, as in the demo.
- User Remark shows any note you added when recording a trade, and Modified reads Yes once you have corrected the row, for example to match a real fill price. Entry Source stays as it was.
Search, choose columns, or Export CSV to take the whole log elsewhere.
Cash Ledger
The Cash Ledger is every movement of the simulation's cash, newest first.
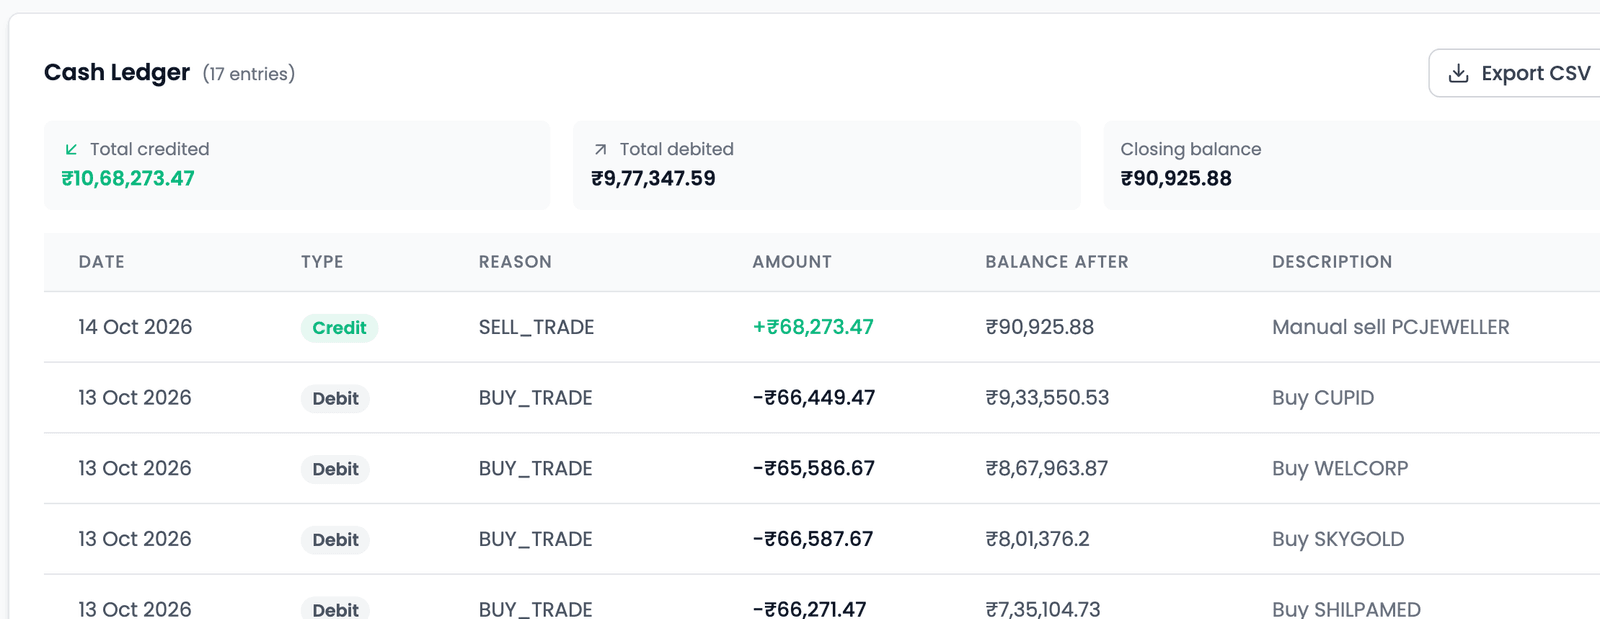
Three totals at the top (Total credited, Total debited and Closing balance) are followed by each entry: its date, whether it was a credit or debit, the reason (the starting capital, a buy, a sell), the amount and the balance after it. The closing balance is the Cash Balance card. It can be exported as CSV too.
Configuration
Configuration shows the rules the simulation is running and how they have changed.
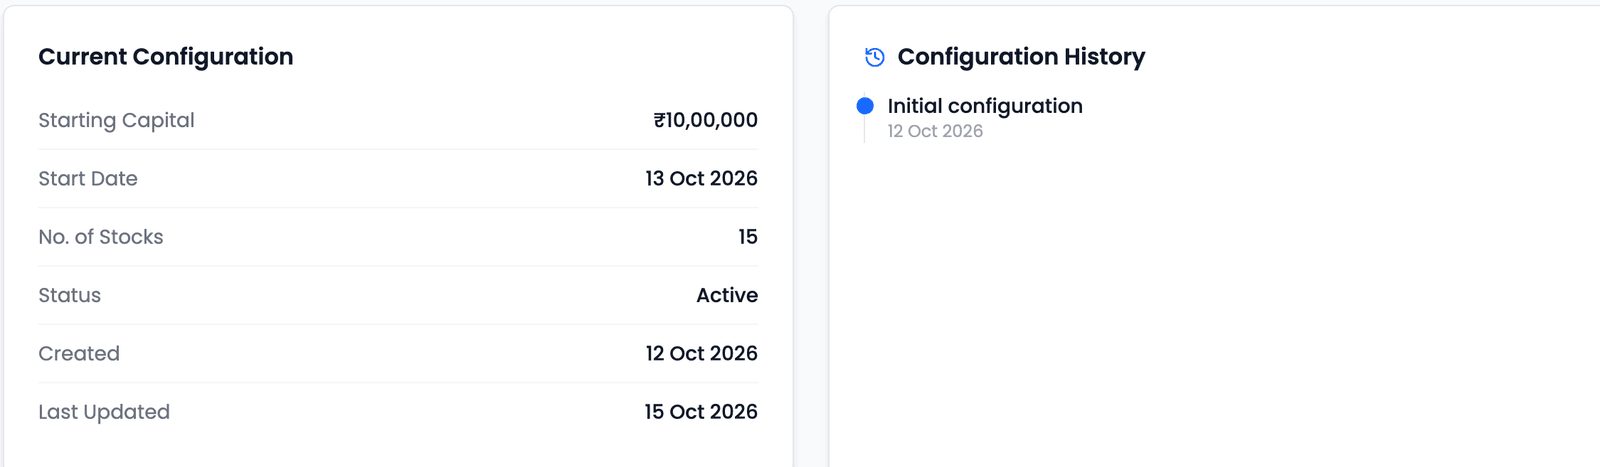
Current Configuration sums up the simulation itself, and Configuration History lists every change to its rules, starting with Initial configuration. Below them, Strategy Parameters shows the full rule set, with an Edit Settings button for changing it from the next rebalance onward.
Logs and Export
Logs, in the header, opens Activity Logs: everything the simulation has done, newest first, filterable by Rebalances, Execution Adjustments, Configuration and System.
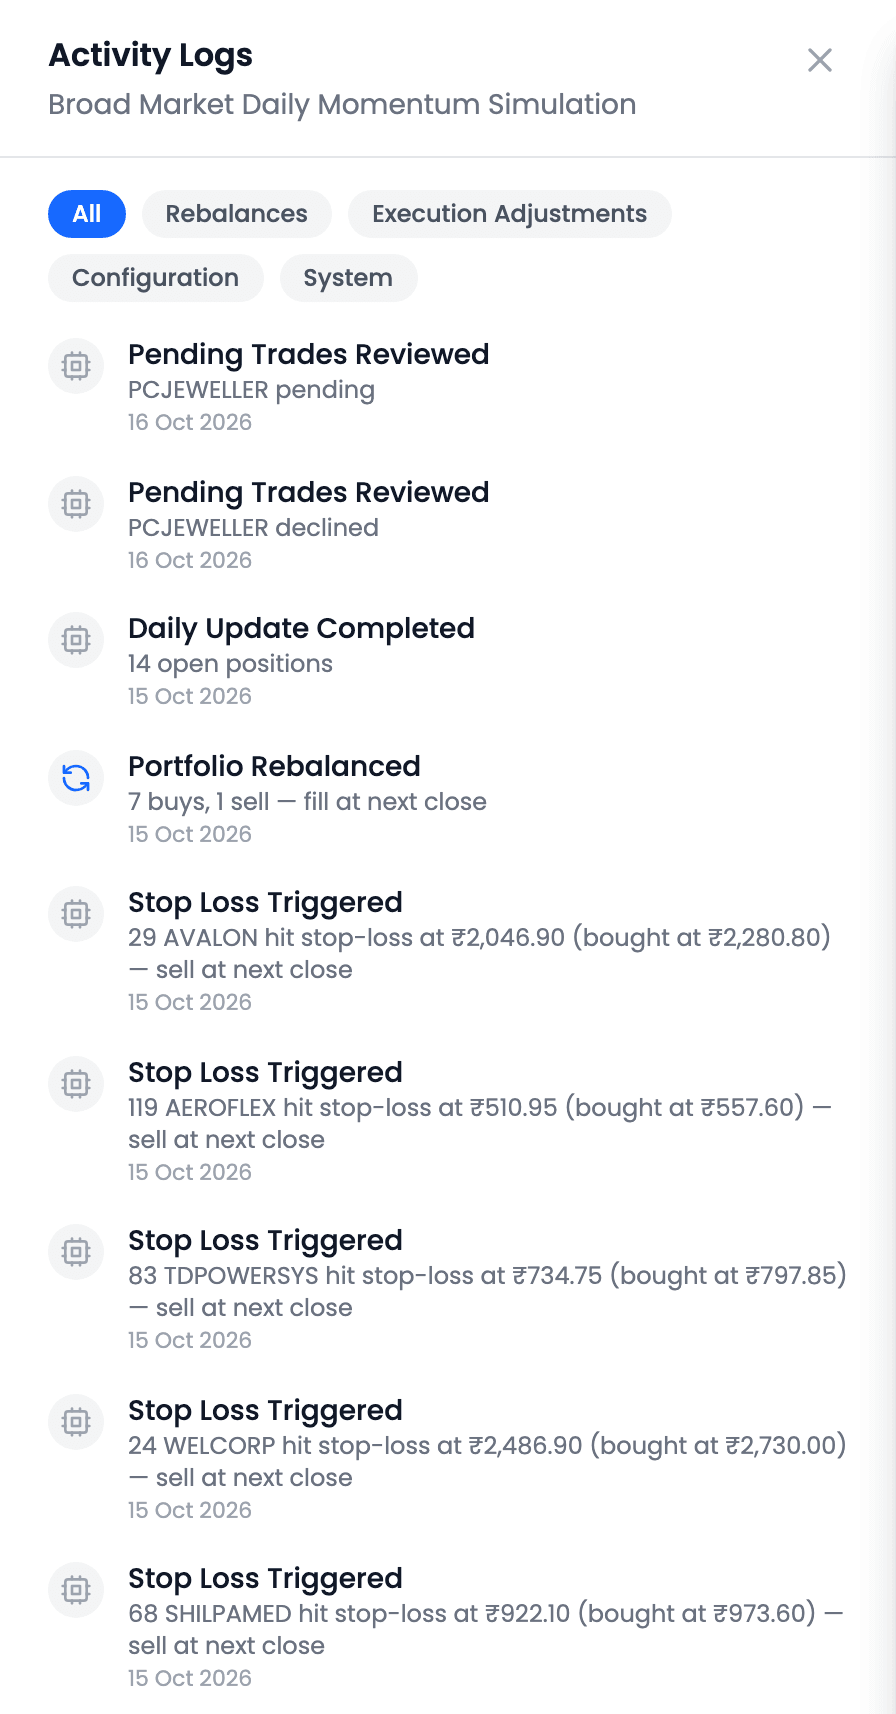
It is the place to answer why: why a stock was sold, when a rebalance ran, what you changed and when. Export produces a report of the simulation as an HTML file.
Why there is no Score
A simulation is not graded
A backtest gets a Score because it is a pure test: one set of rules over one stretch of history. A simulation isn't. It runs forward through conditions no backtest has seen, and it can include your own decisions: trades you rejected, real fills you recorded, settings you changed. A single grade would mix all of that together, so the page shows the record instead and leaves the judgment to you.
Reading it well
Give it time. This demo was down 2.97% three days in, after a sharp fall on one day. That is a fact about three days, not about the rules. The Key takeaway waits 30 days for the same reason.
When there is enough history, compare the simulation with the backtest you started from, over several rebalances: is it trading about as often, are its drawdowns of a similar kind, do its sells happen for the reasons you expected? Differences are normal, because the market is different. Differences you can't explain are the ones to look into, starting with the Logs.
And keep it in proportion. A simulation shows how your rules behave on paper; historical and simulated results don't guarantee future performance, and what you do with real money remains your decision.
Common questions
Why are my simulation's ratios so extreme?
Ratios like Sharpe and Sortino are annualised, so a few days of price moves turn into very large figures. They settle as the history grows; don't read them in the first weeks.
What is the difference between Portfolio Value and Invested Value?
Portfolio Value is the whole portfolio at today's prices, holdings plus cash. Invested Value is what the current holdings cost to buy. The gap between the holdings' value and Invested Value is the unrealised gain or loss.
Why don't Total Return and the % under Portfolio Value match?
Total Return is before transaction costs; the % under Portfolio Value is after them. The difference is what the simulation's trades have cost so far.
Where do I see profit on trades that have closed?
In the Trade Log. Each row is one round trip; a Closed row shows its final return. There is no separate Realised P&L card.
Why does my simulation have no Score?
A Score grades a pure historical test. A simulation runs forward and can include your own decisions, so it shows its record instead of a grade.
Key takeaways
- A simulation's page is a running record, not a verdict: it has no Score.
- Portfolio Value is everything at today's prices; Invested Value is what the holdings cost; Current Value is one holding; Starting Capital never changes.
- The Key takeaway says Too early to judge for the first 30 days, and that is the right reading of any early result.
- Active Portfolio shows each holding's rank today; >30 means it has slipped past the Exit Rank.
- The Trade Log is one row per round trip, with Status and Entry Source explaining each; the Cash Ledger is every rupee in and out.
- Logs answers why something happened; Configuration History shows what you changed and when.